


eBird Science
eBird transforms the global birding community's passion for birds into a powerful resource for research, conservation, and education.
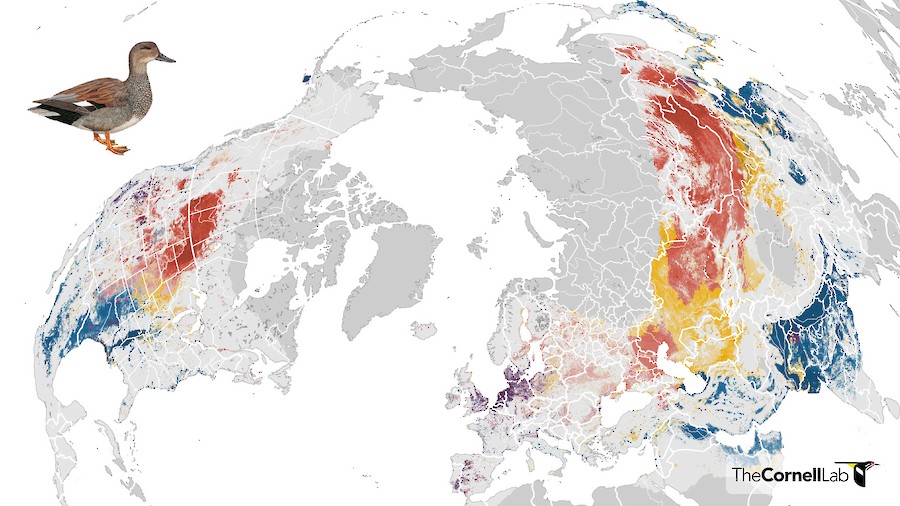
eBird Status and Trends
High-resolution data, visualizations, and tools describing where bird populations occur and how they change through time—powered by eBird data and updated annually, providing you with the best available science.

Use eBird Data and Tools
eBird is a powerful resource for a wide range of scientific questions. Learn how to access, analyze, and cite eBird data and tools.

Research and Conservation Applications
eBird plays an increasingly important role in science and conservation. Applications of eBird data range from research and monitoring to species management, habitat protection, and informing law and policy.
Recent Science News

eBird in Action: North American Bird Declines are Greatest Where Species are Most Abundant
Your eBirding data helps create tools that can be used to further conservation, inspire support, and inform ecological management strategies. eBird in Action is a segment which shares the conservation stories made possible because of your contributions.

New Data and Tools for eBird Status and Trends
eBird Status and Trends products are updated annually with millions of new observations submitted by eBirders to provide the most up-to-date information on the status and trends of bird populations. This year, the team released new tools, added regional trends summaries, and made Trends data available for download.

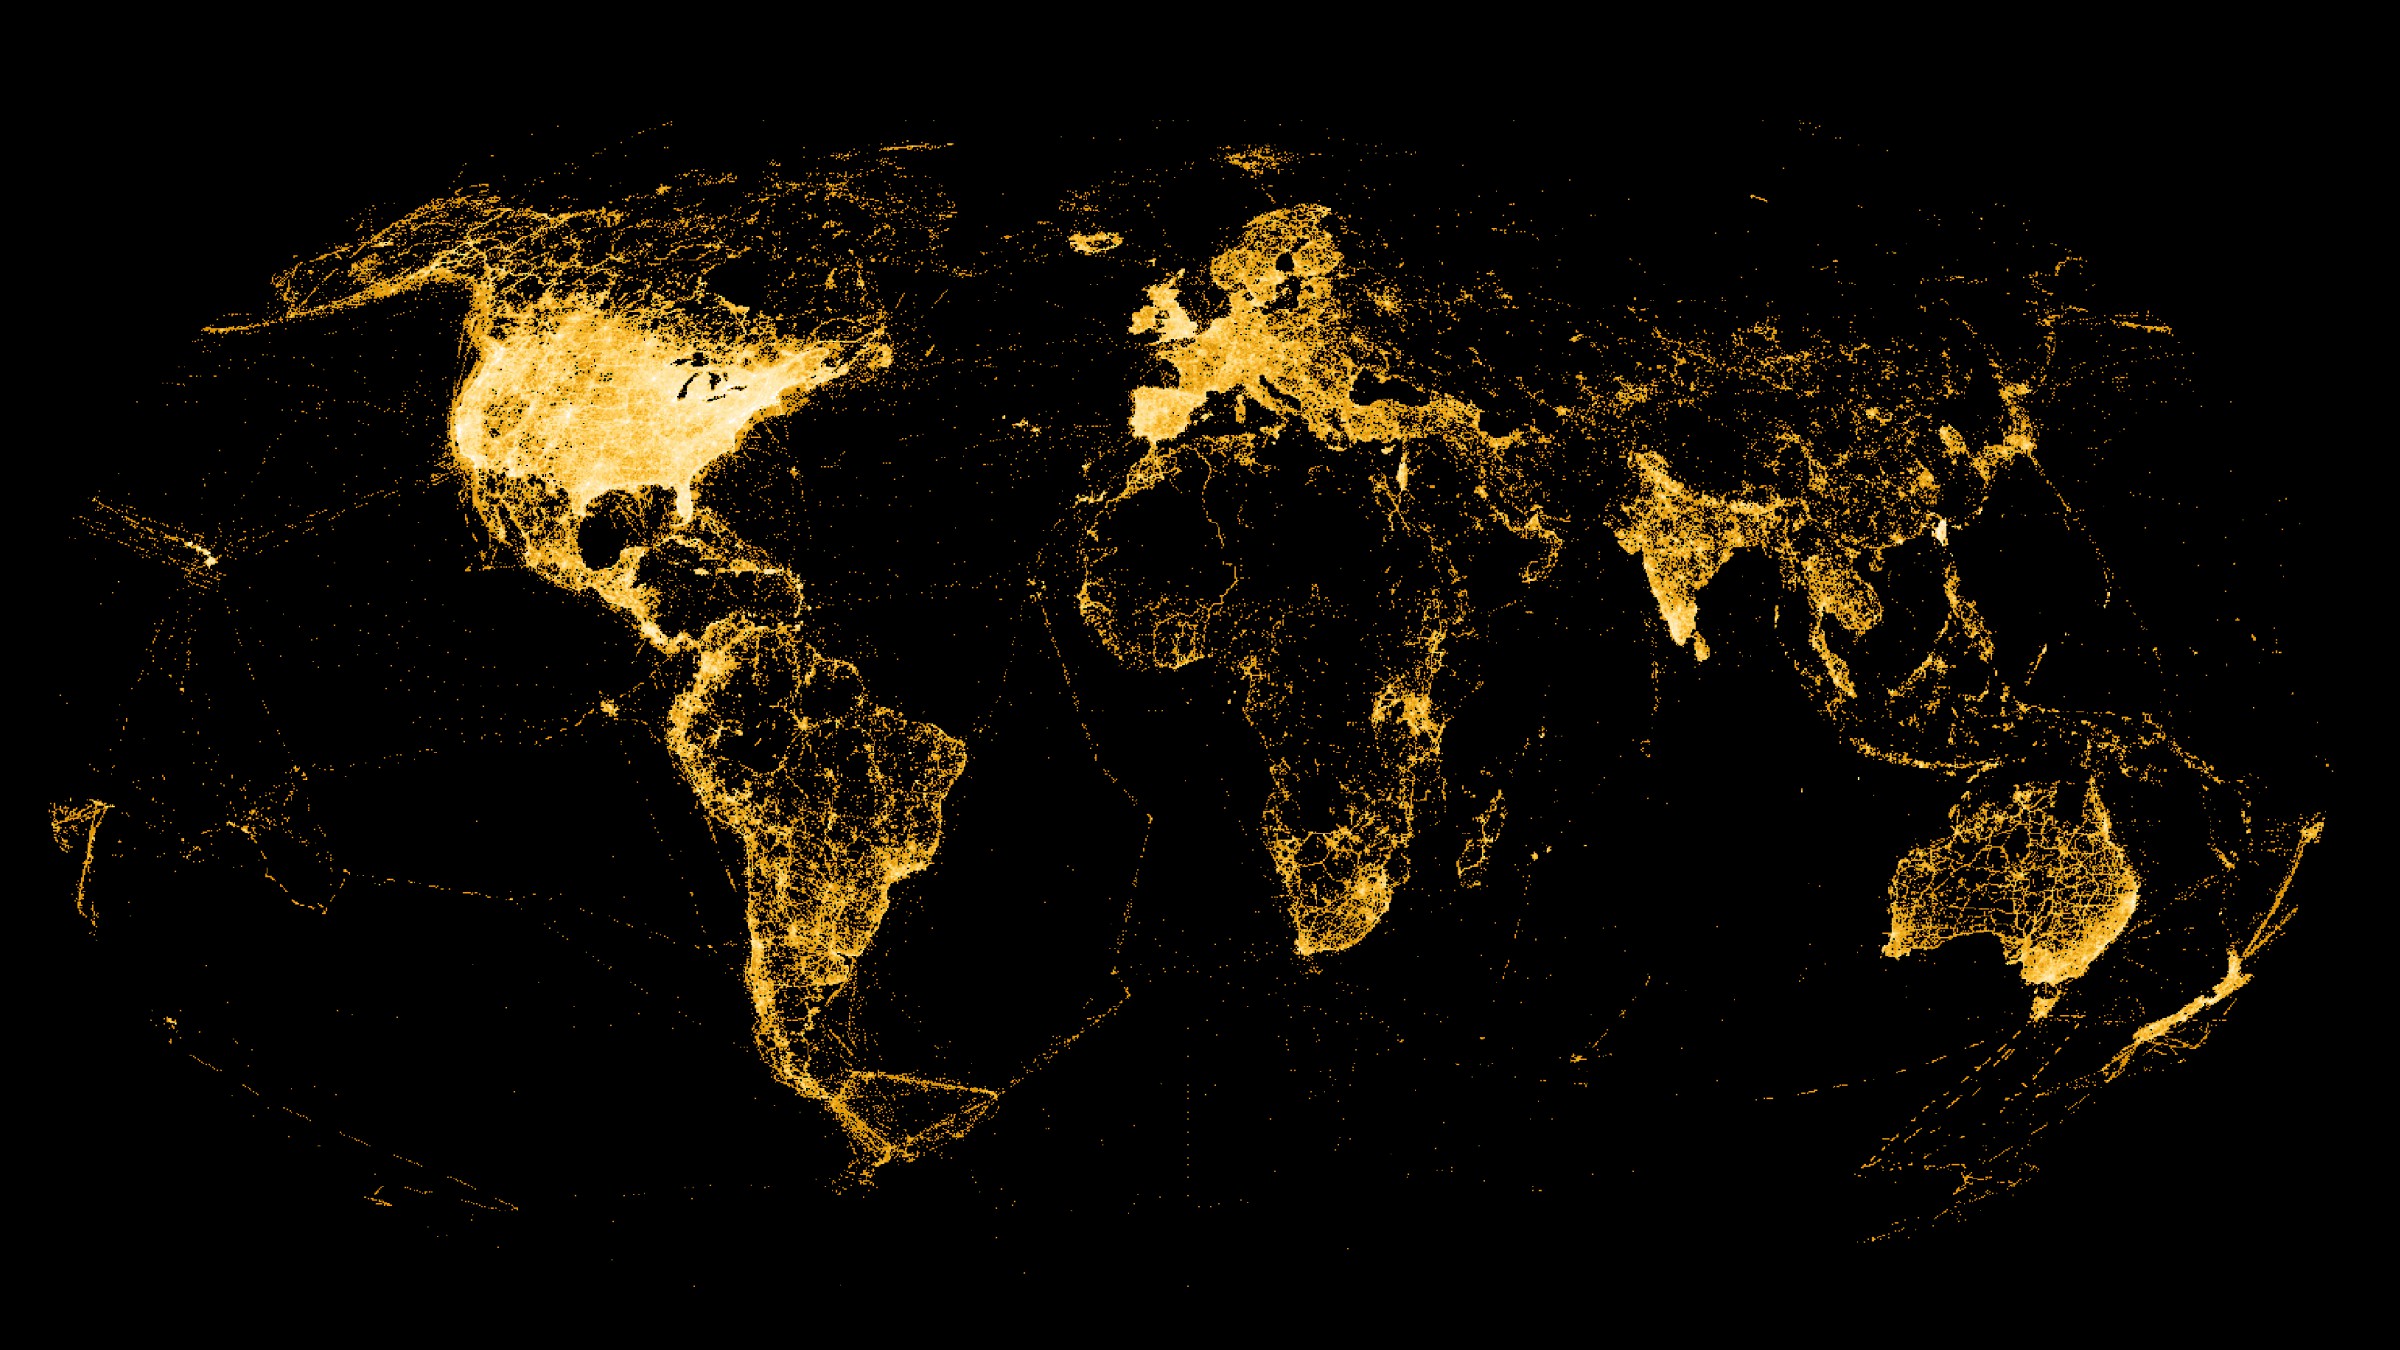
Updated abundance and range maps for 2,068 species
Every year the eBird Status and Trends project updates the maps with millions of new observations submitted by eBirders. This year, the team modeled relative abundance for 868 additional species across the globe using data from 464,542 eBirders—bringing the total number of species with visualizations to 2,068.