


eBird estatusa eta joerak
eBird-ek datu zientifiko osatuenak eskaintzen dizkizu, urtero eguneratzen direnak. Hegazti populazioak non agertzen diren eta denboran zehar nola aldatzen diren deskribatzen duten bereizmen handiko datuak, bistaratzeak eta erremintak eskaintzen dizkizu.
Visualizations and Data Products
The eBird Science team uses state-of-the-art statistical models and machine learning to build visualizations and tools to help decision makers, scientists, and birders alike to better understand migration, abundance patterns, range boundaries, and much more. The team compiles raw eBird data (the when and where people report birds) and high-resolution satellite imagery from NASA, NOAA, and USGS into cutting-edge statistical models to predict population trends and to predict when, where, and in what numbers species occur every week of the year.
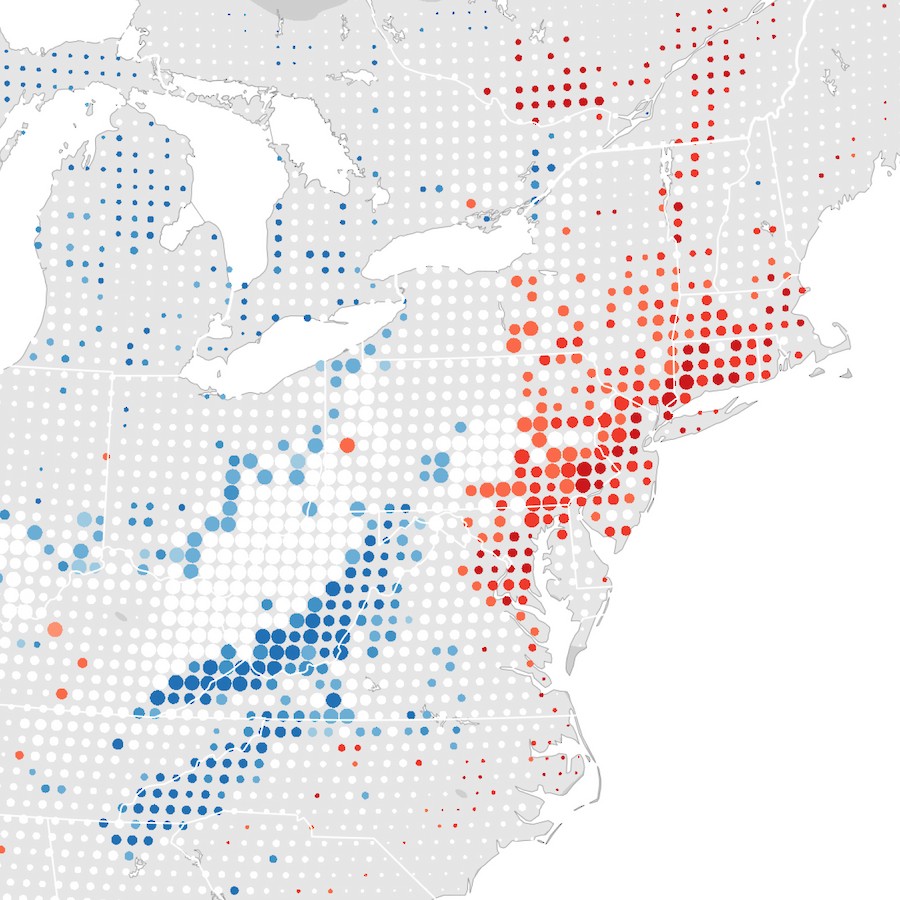
Trends in Bird Abundance
Explore abundance trends of select bird species where you live. eBird Trends maps reveal where birds are increasing or decreasing within a 27 x 27 km area since 2012. eBird Trends maps provide the most detailed picture of bird populations available, helping power new insights to reverse bird declines.
Learn more about trends maps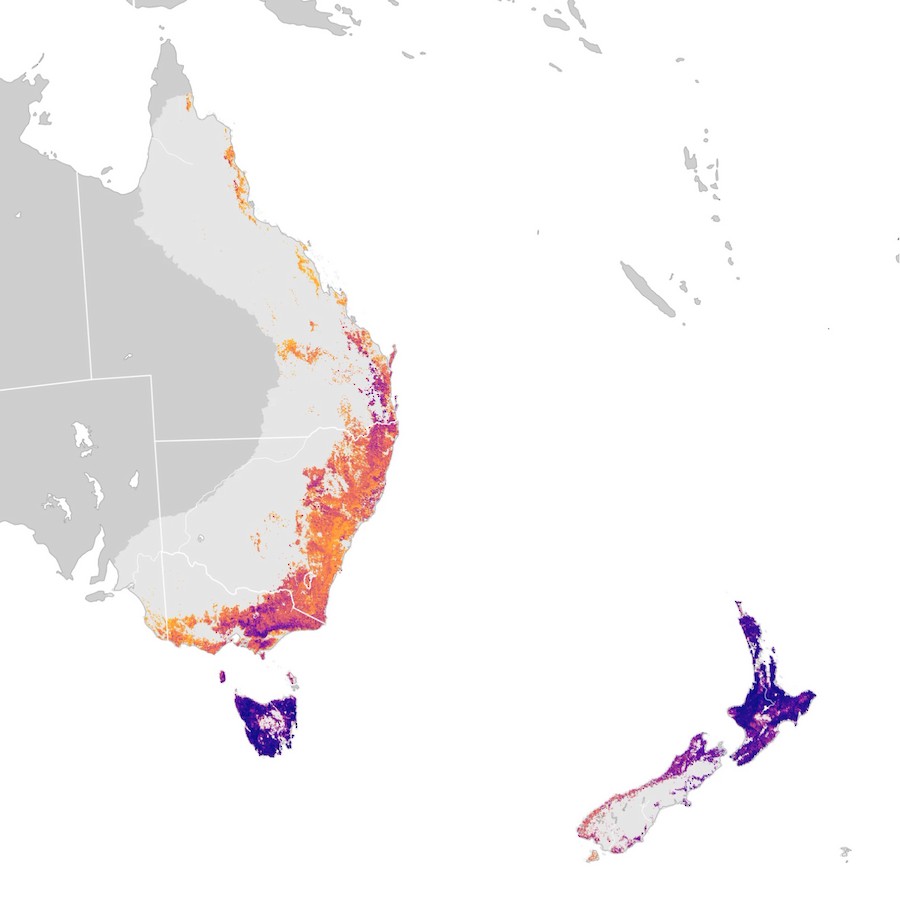
Migratory Journeys and More Revealed
Ezagutu espezie batek noiz migratzen duen, nora joaten den eta non eta noiz diren ohikoenak ugaritasun-animazio liluragarri hauekin. Punta-puntako bistaratze hauek hegaztien biologiari eta migrazio-ekologiari buruzko ulermena hobetzen duten ugaritasun-ereduetan urteko aldaketak nabarmentzen dituzte eta kontserbazio-ekintzak gidatzen dituzte.
Murgildu ugaritasun-animazioetan eta bilatu adibide nabarmenenak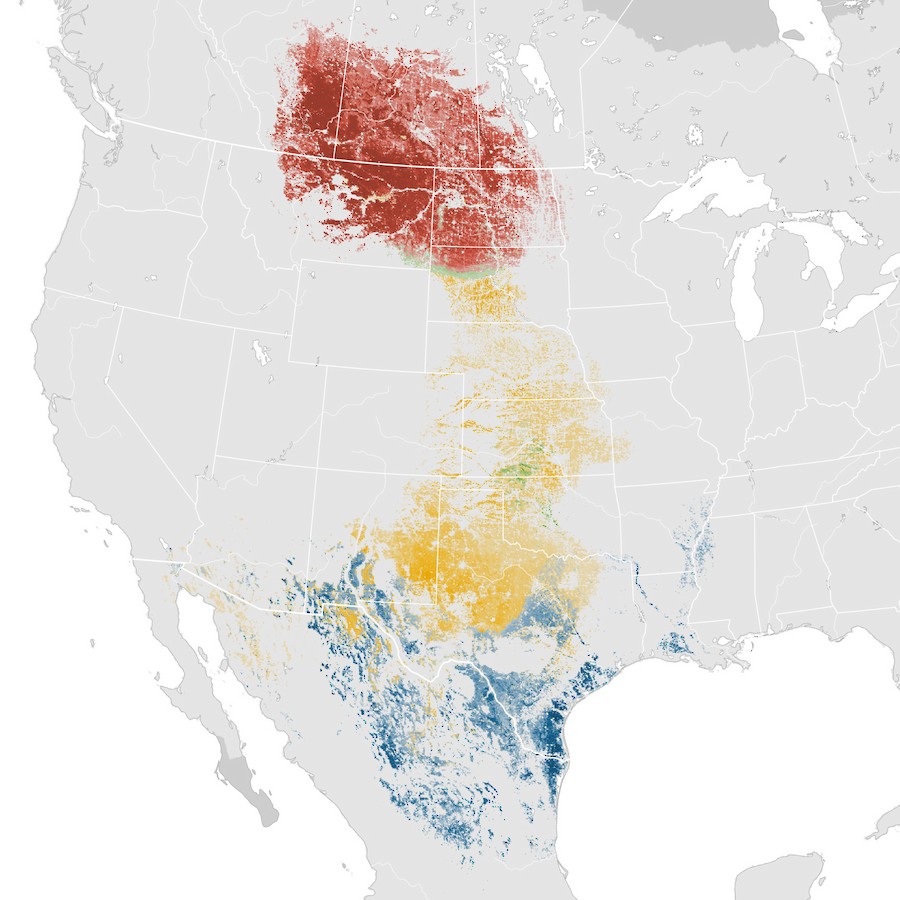
Hegazti ugaritasuna—mapeatuta
State-of-the-art statistical models join forces with eBird data to visualize seasonal abundance to help decision-makers prioritize management and conservation actions, and to help you find more birds to power your birding year-round.
Jakin gehiago ugaritasun mapen inguruan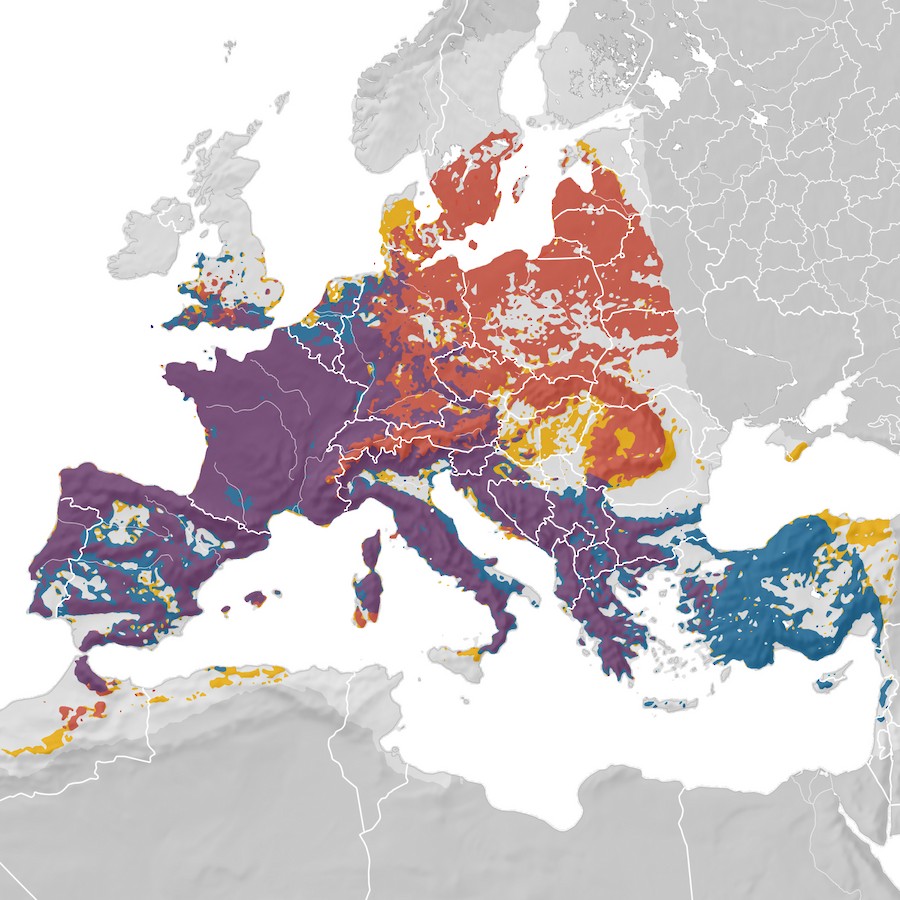
Banaketa-mapak
Meet the new and improved range map based on analytical results powered by eBird sightings to give you more precise information on species distribution. Discover just how far north or south, or east or west a species is expected to occur.
Jakin gehiago banaketa-mapen inguruan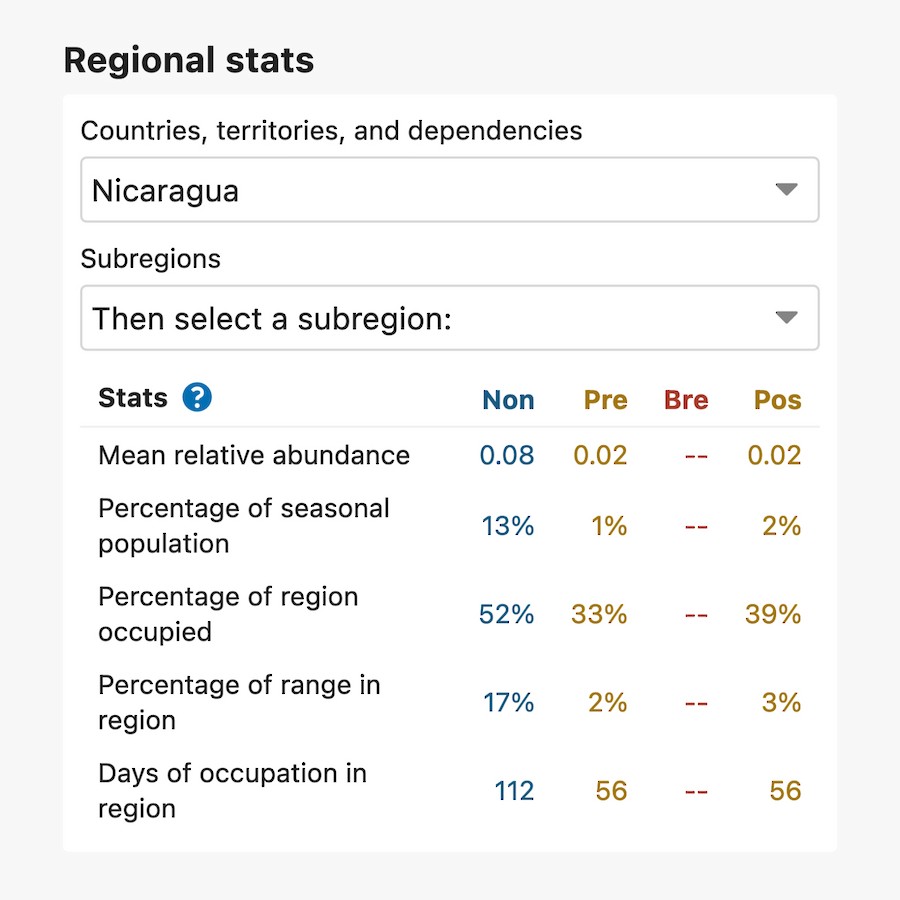
Lortu zure herrialde edo eskualdeko kopuruak
Summaries of relative abundance, percent of seasonal modeled population, and cumulative trends are now available for regions at the state or province level. Select the region of interest and get summary statistics to aid in conservation planning and more.
Learn more about summary statisticsDownload the Data Products
eBird Status and Trends Data Products include estimates of species ranges, abundances, and environmental associations. The Data Products behind the visualizations are made publicly available six months after the visualizations are updated on the website (note: this creates a six month mismatch). The data products are available through an access request form and can be downloaded using an R package. To request access to the Data Products, download regional range and abundance tables or spatial range map data for the latest results, follow the link below.
Download the Data ProductsThe new data-driven maps and animations are made possible through support from the National Science Foundation, Wolf Creek Charitable Foundation, Leon Levy Foundation, NASA, Amazon Web Services, Institute for Computational Sustainability, and the NSF Advanced Cyberinfrastructure Coordination Ecosystem: Services & Support (ACCESS) program.
Supporters
