


視覺化與資料產品
eBird Science團隊使用最新開發的統計模型與機器學習來產出視覺化呈現工具,這能幫助決策者、科學家以及賞鳥人更好的了解遷徙、豐度模式與分布邊界等資訊。該團隊整合eBird資料(eBirder們何時何地在哪紀錄鳥)與NASA、NOAA和USGS高解析度的衛星影像產出統計模型,能用來預測鳥種的族群趨勢以及鳥種一整年中每週在各處的數量。
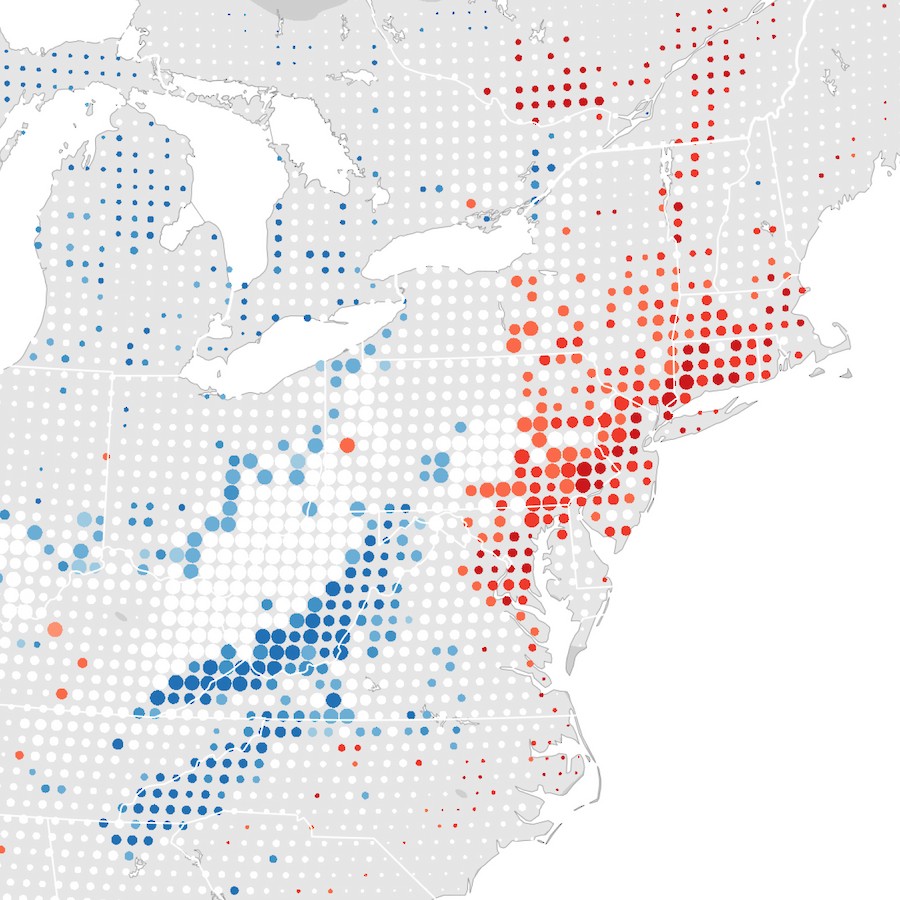
鳥類豐度趨勢
你可以用eBird趨勢地圖了解鳥種在特定地區的豐度趨勢,這份地圖能告訴你在27x27公里地區尺度下這些鳥從2012年來是變多還是變少,有助於發展出新的見解以扭轉鳥類減少的趨勢。
了解更多有關趨勢地圖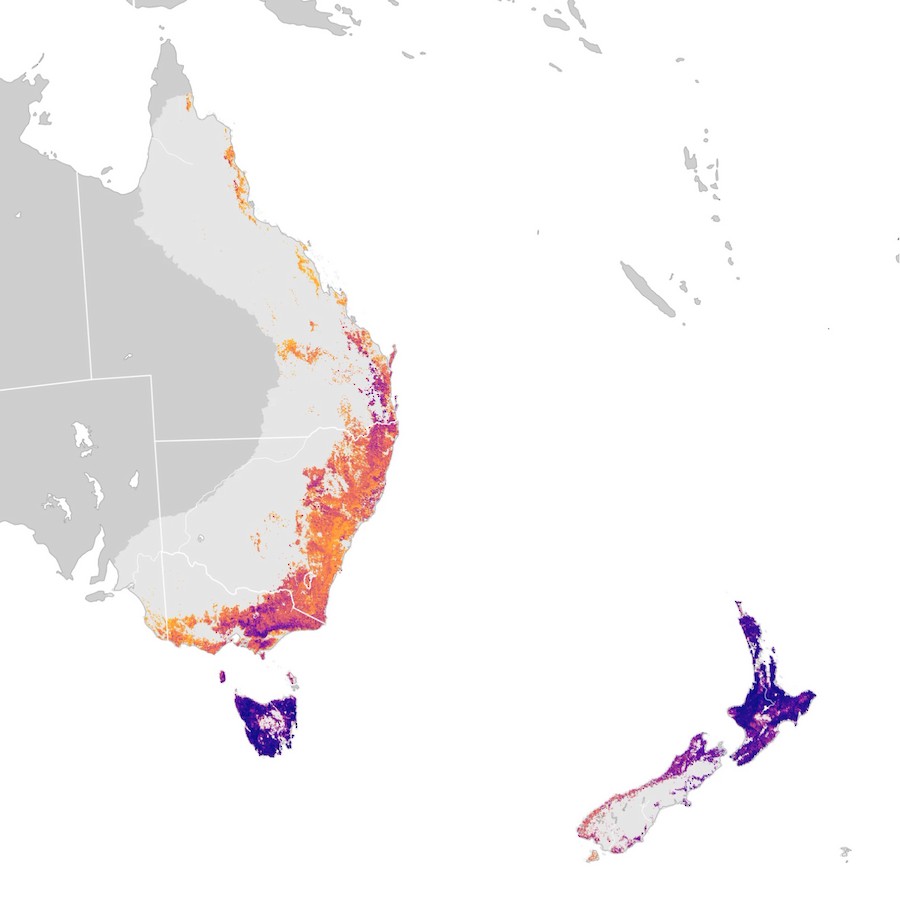
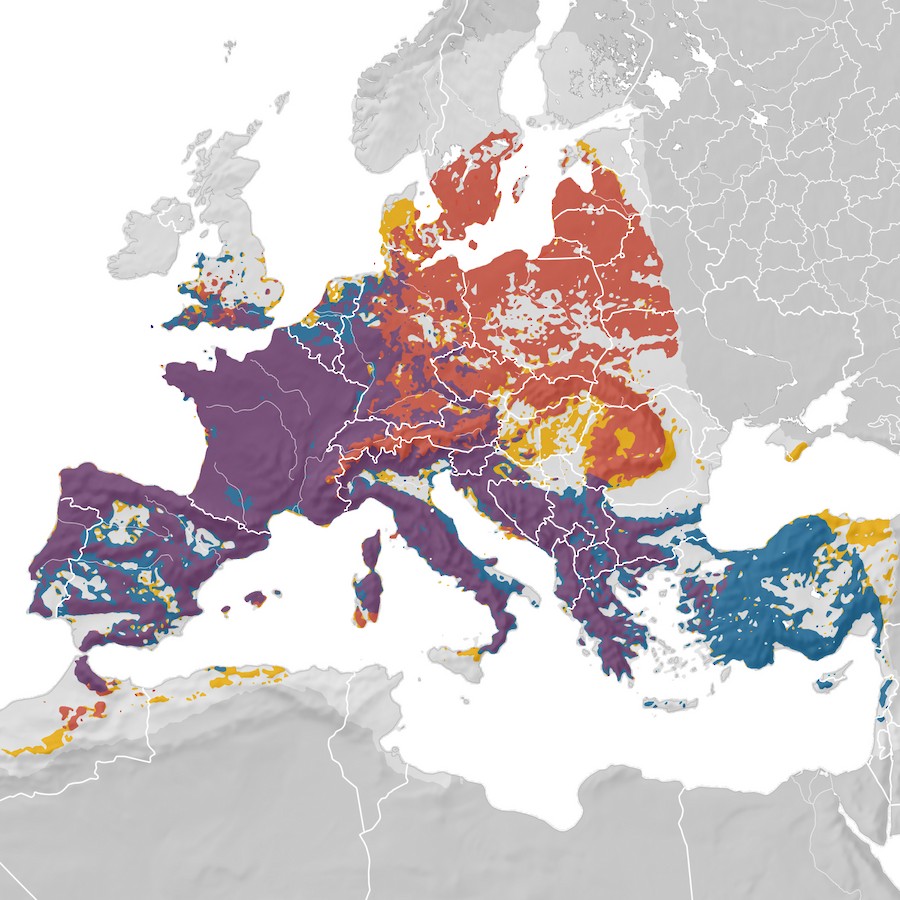
遷徙旅程和其他更多顯示
透過這些精美的每週豐度動畫,可以了解這些鳥種何時開始遷徙、牠們去了哪裡以及哪裡數量最多。透過最新的視覺化技術凸顯出鳥種的時空數量動態變化狀況,來協助我們認識鳥類生態與遷徙還能協助保育行動規劃。
深入研究每週豐度地圖並探索精彩的範例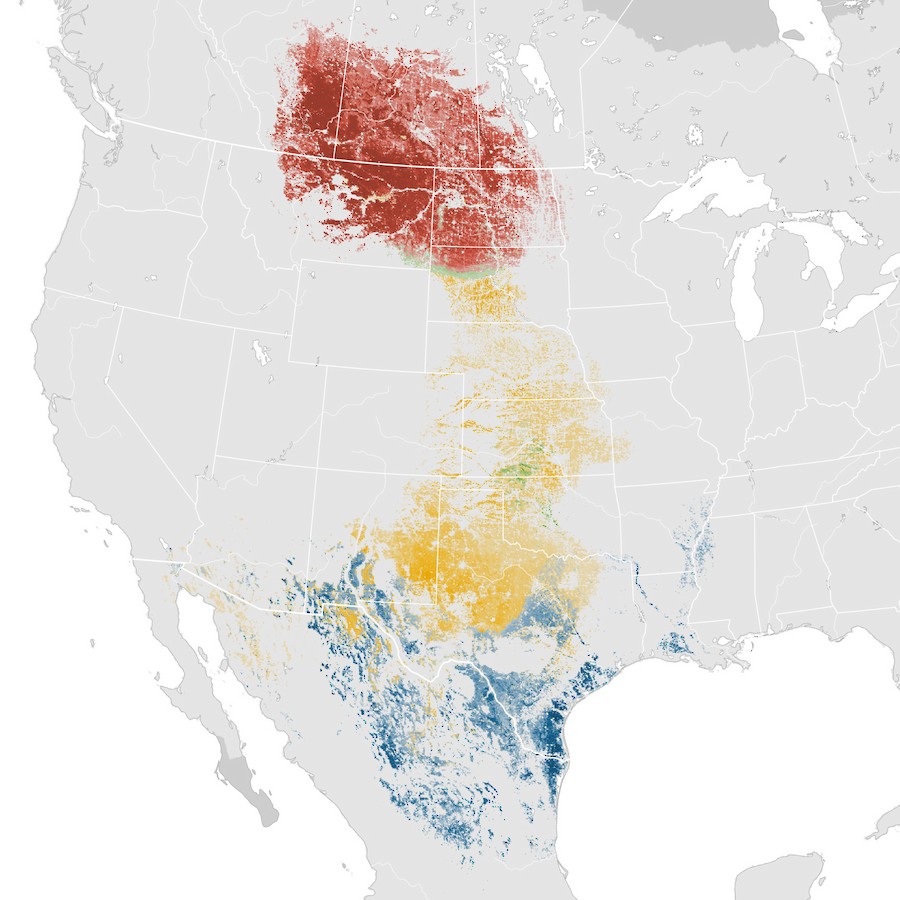
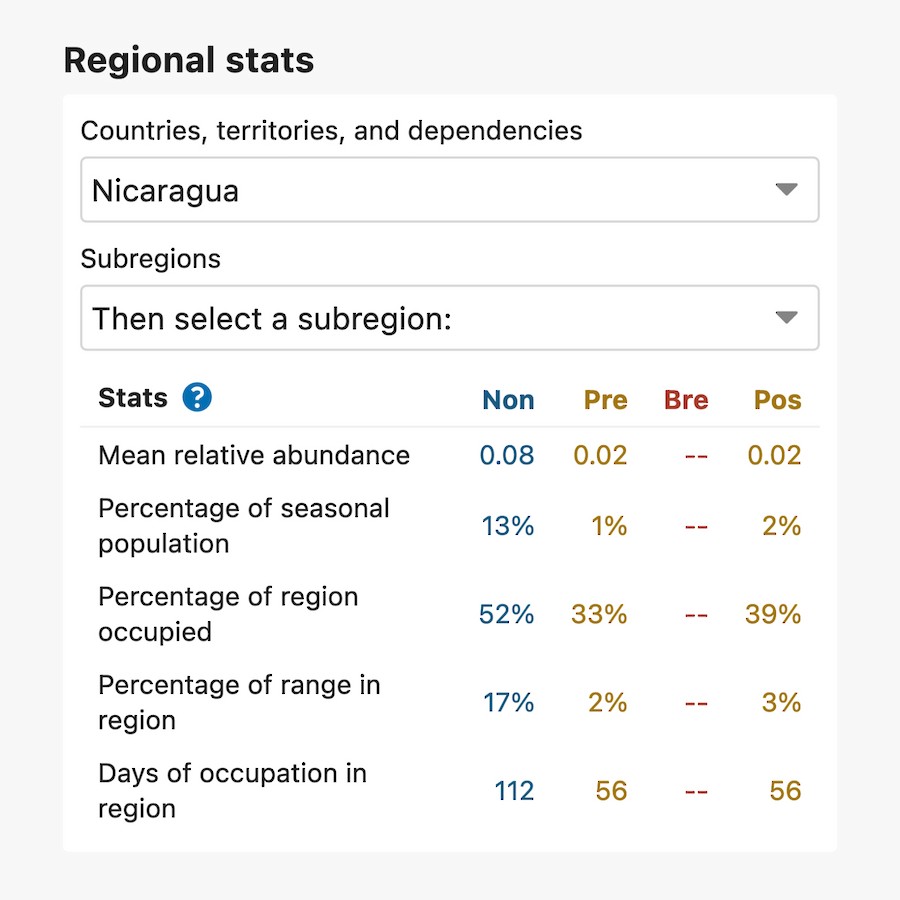
取得你所在的週或地區的統計數據總結
現在可以得到週或地區級別的相對豐度、季節模型族群百分比以及累積趨勢等統計數據的總結。選擇感興趣的區域獲得數據後,可以幫助制定保育計畫等行動。
了解更多有關統計數據摘要下載資料產品
eBird 現況與趨勢資料產品包括鳥種分布、數量和環境關聯估計值。這些用以產生視覺作品用的資料產品將在視覺化完成後6個月在網站上更新(注意:這導致有6個月的時間差)。資料產品可透過填寫索取表或直接由 R 下載。點擊以下連結來下載最新的資料產品、區域分布和數量資料表或分布地圖。
下載資料產品這些全新推出以資料為基礎產生的地圖和動畫是在以下單位的支持下才有機會完成:美國國家科學基金會、Wolf Creek Charitable Foundation、Leon Levy Foundation、NASA、Amazon Web Services、Institute for Computational Sustainability,以及NSF Advanced Cyberinfrastructure Coordination Ecosystem: Services & Support (ACCESS) program。
Supporters
