


Статус и тенденции eBird
Изучите статус и тенденции для разных видов птиц с помощью карт, схем местообитаний, еженедельных анимированных роликов миграции и другое - все сгенерировано с помощью данных eBird.
Visualizations and Data Products
Функции "Статус" и "Тенденции" eBird обеспечивают непревзойденную возможность понаблюдать за полным годовым циклом популяций птиц в Северной Америке. Научные работники Корнелльской лаборатории орнитологии разработали эти новаторские статистические методы для моделирования данных eBird на всех континентах с использованием высокоточной пространственно-временной шкалы. Карты, графики и другие продукты исследуют ареал, обилие, места обитания и тенденции для каждого вида.
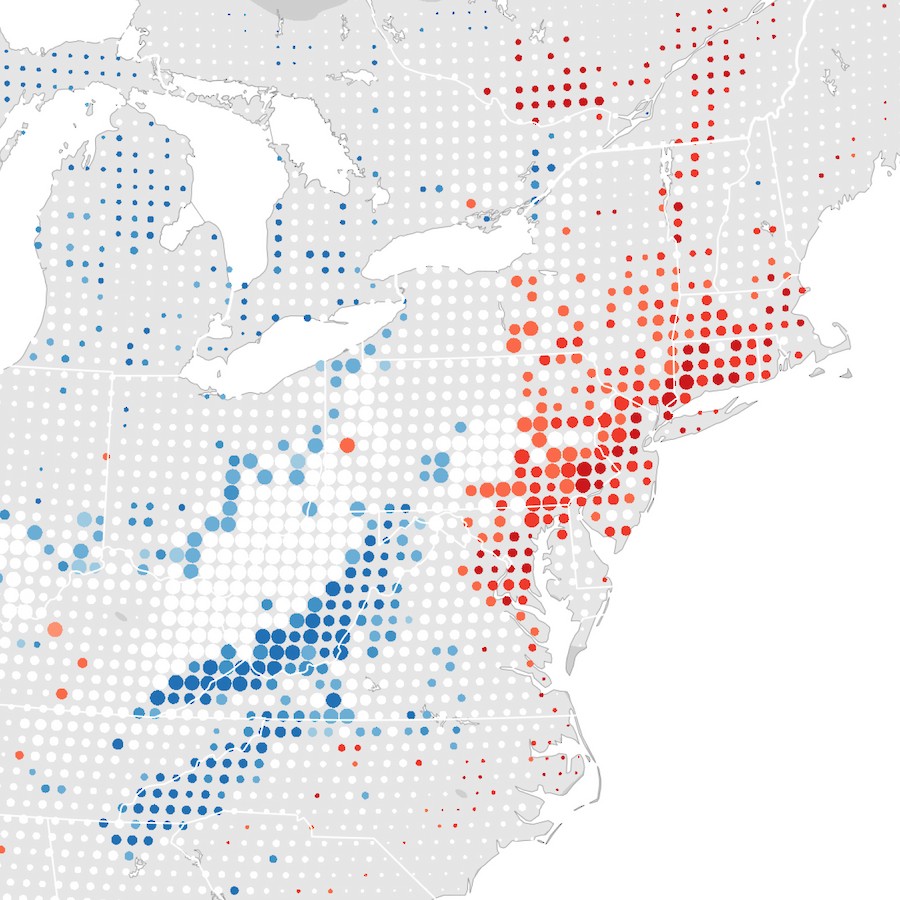
Trends in Bird Abundance
Explore abundance trends of select bird species where you live. eBird Trends maps reveal where birds are increasing or decreasing within a 27 x 27 km area since 2012. eBird Trends maps provide the most detailed picture of bird populations available, helping power new insights to reverse bird declines.
Learn more about trends maps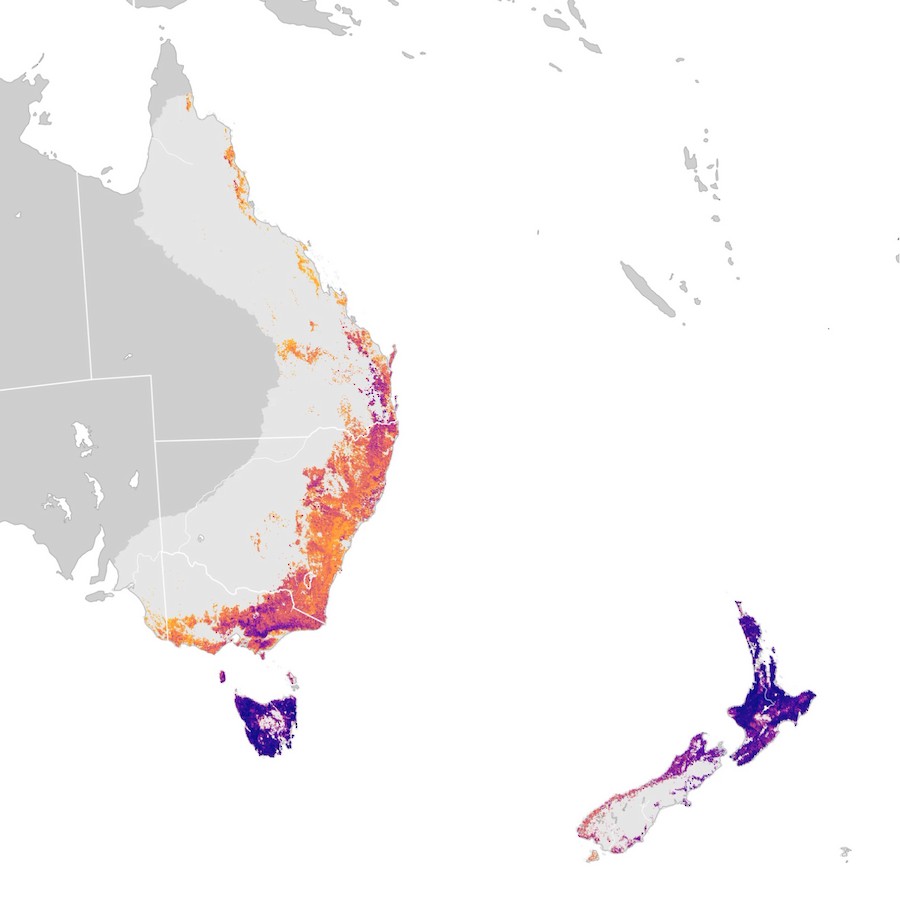
Migratory Journeys and More Revealed
Discover when a species migrates, where they go, and where and when are they most common with these mesmerizing weekly abundance animations. These state-of-the art visualizations highlight annual changes in abundance patterns that improve our understanding of bird biology and migration ecology, and guide conservation actions.
Dive deeper into weekly abundance maps and explore featured examples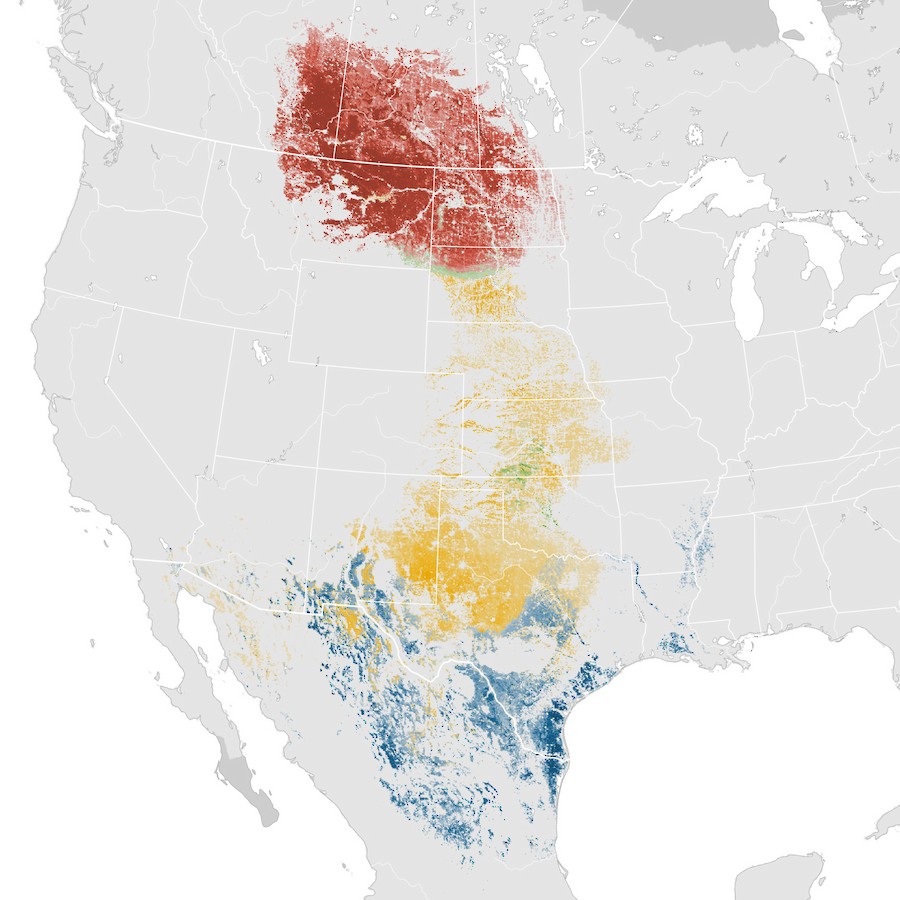
Bird Abundance—Mapped
Современные статистические модели объединяются с данными eBird для визуализации сезонного обилия, что помогает лицам, принимающим решения, определять приоритеты в управлении и природоохранных действиях, а также помогает вам найти больше птиц.
Узнайте больше о картах плотности популяции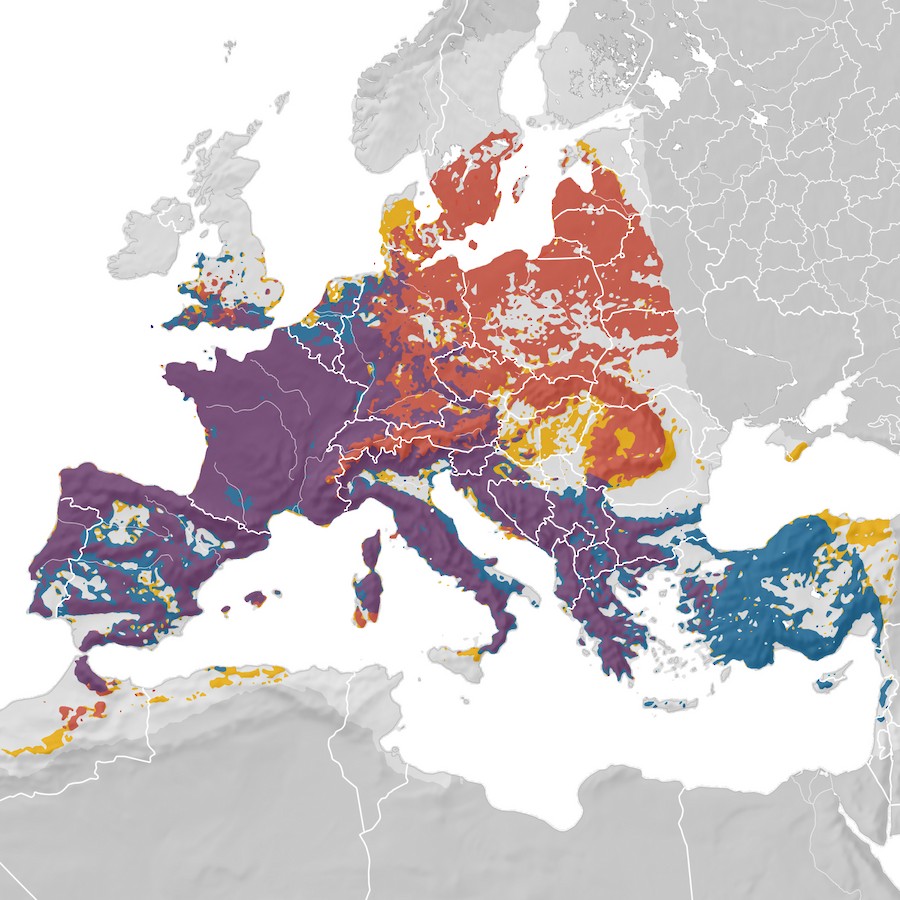
Range Maps
Meet the new and improved range map based on analytical results powered by eBird sightings to give you more precise information on species distribution. Discover just how far north or south, or east or west a species is expected to occur.
Learn more about range maps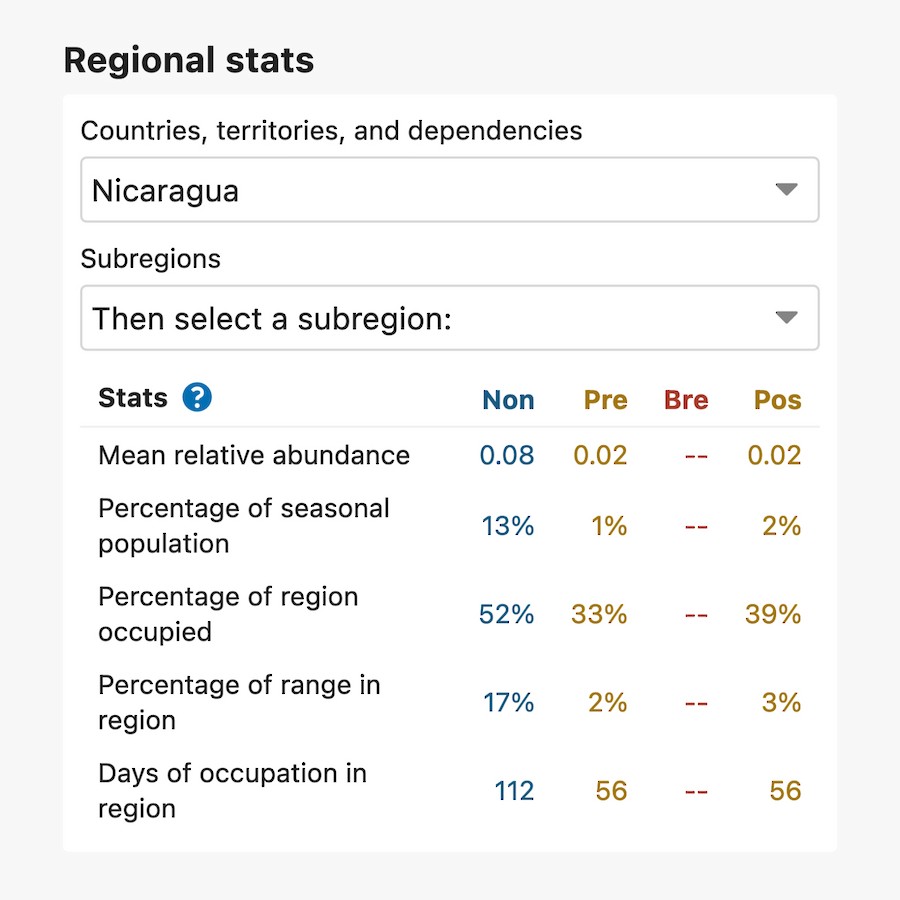
Get the Summary Statistics for Your State or Region
С помощью таблиц численности и ареала можно узнать относительную численность или процент территории, занимаемой тем или иным видом. Таблицы включают оценки, которые помогут специалистам определить приоритетность усилий по управлению и охране природы и получить лучшее представление о сезонном использовании штатов или регионов. Орнитологи также могут использовать эти таблицы, чтобы узнать, как долго тот или иной вид присутствует в их регионе.
Learn more about summary statisticsDownload the Data Products
eBird Status and Trends Data Products include estimates of species ranges, abundances, and environmental associations. The Data Products behind the visualizations are made publicly available six months after the visualizations are updated on the website (note: this creates a six month mismatch). The data products are available through an access request form and can be downloaded using an R package. To request access to the Data Products, download regional range and abundance tables or spatial range map data for the latest results, follow the link below.
Download the Data ProductsThe new data-driven maps and animations are made possible through support from the National Science Foundation, Wolf Creek Charitable Foundation, Leon Levy Foundation, NASA, Amazon Web Services, Institute for Computational Sustainability, and the NSF Advanced Cyberinfrastructure Coordination Ecosystem: Services & Support (ACCESS) program.
Supporters
