


סטטוס ומגמות eBird
עיינו בסטטוסים ובמגמות של מיני ציפורים - מפות, גרפי בתי גידול, הדמיות נדידה שבועיות ועוד - הכל תוצרת מודלים המבוססים על מידע eBird.
ויזואליזציה ותוצרי הנתונים
סטטוסים ומגמות eBird מספקים חלון ייחודי למחזור השנתי המלא של אוכלוסיות ציפורים בצפון אמריקה. חוקרי מעבדת האורניתולוגיה של קורנל פיתחו שיטות סטטיסטיות חדשניות כדי למדל מידע eBird בקנה מידה יבשתי, במימדי זמן ומרחב מדויקים. מפות, גרפים ותוצרים נוספים מאפשרים להכיר את אזור התפוצה, השפע, בית הגידול והמגמות של כל מין ציפור.
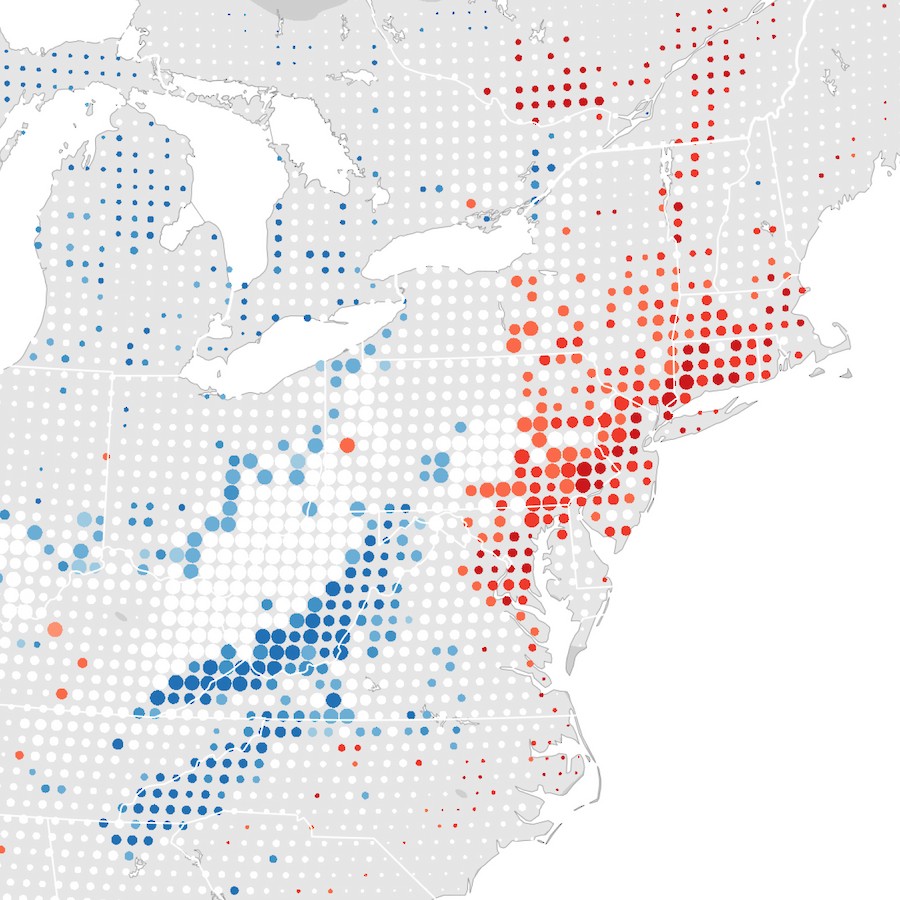
מגמות בשפע ציפורים
חקרו את מגמות השפע של ציפורים נבחרות במקום מגורכם. מפות המגמות של eBird חושפות איפה ציפורים עולות או יורדות במספרים בטווחים של 27x27 ק״מ מאז שנת 2012. מפות המגמות של eBird מספקות את תמונת המצב הטובה ביותר לגבי אוכלוסיות ציפורים, ועוזרות לגלות מידע נוסף שיכול לעזור לשימור מינים בסיכון.
למדו עוד על מפות מגמתיות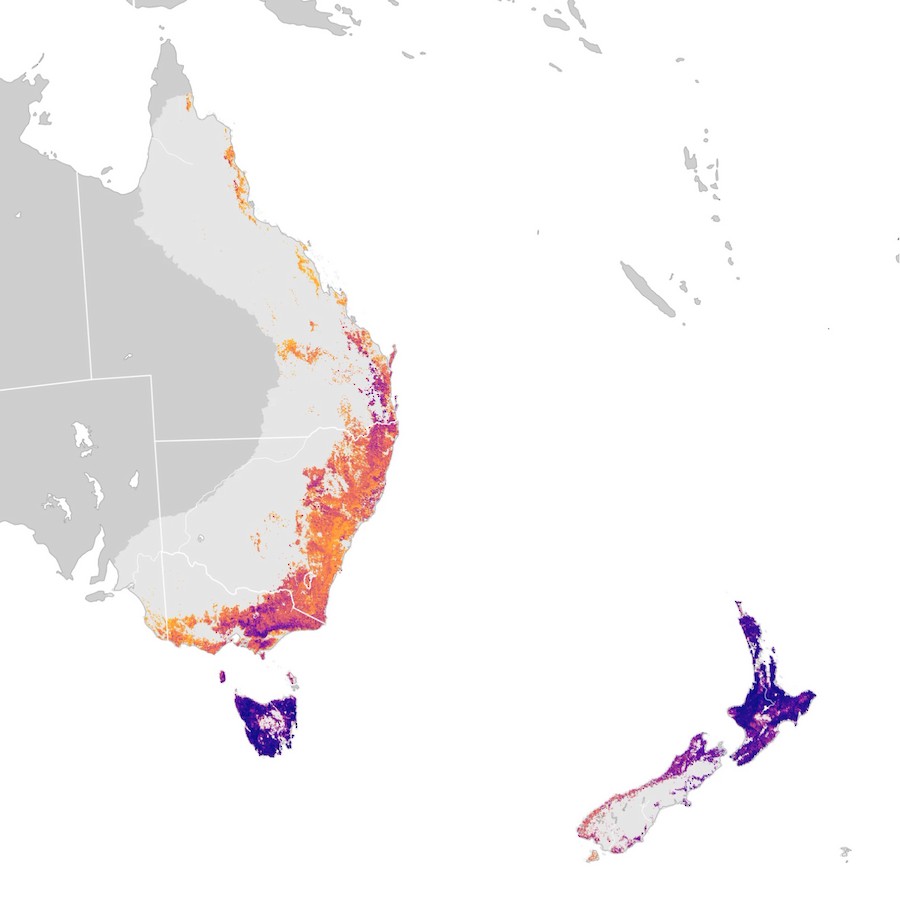
מתגלים מסעות נדידה ועוד
גלו מתי ולאן מינים נודדים, ואיפה ומתי הם הכי נפוצים בעזרת אנימציות השפע השבועי. הדמיות מתקדמות אלה מדגישות שינויים שנתיים בדפוסי שפע המשפרים את ההבנה שלנו לגבי ביולוגית ציפורים ואקולוגיית נדידה, המנתבים פעולות שימור.
חקרו לעומק את מפות השפע השבועי ובדקו את הדוגמאות המוצגות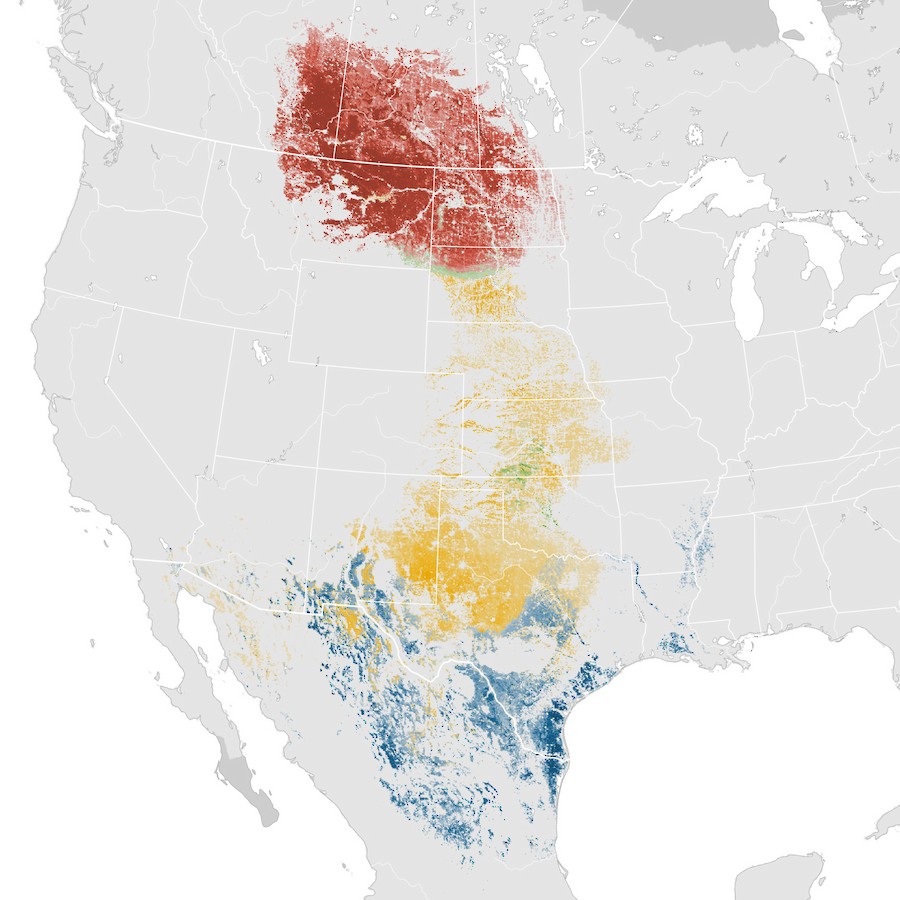
שפע ציפורים— ממופה
מודלים סטטיסטים מתקדמים משלבים כוחות עם נתוני eBird כדי להמחיש שפע עונתי, כדי לסייע למקבלי החלטות לתעדף פעולות שימור וניהול, ולסייע לכם למצוא ולהכיר לעומק יותר ציפורים לאורך כל השנה.
למדו עוד על מפות שפע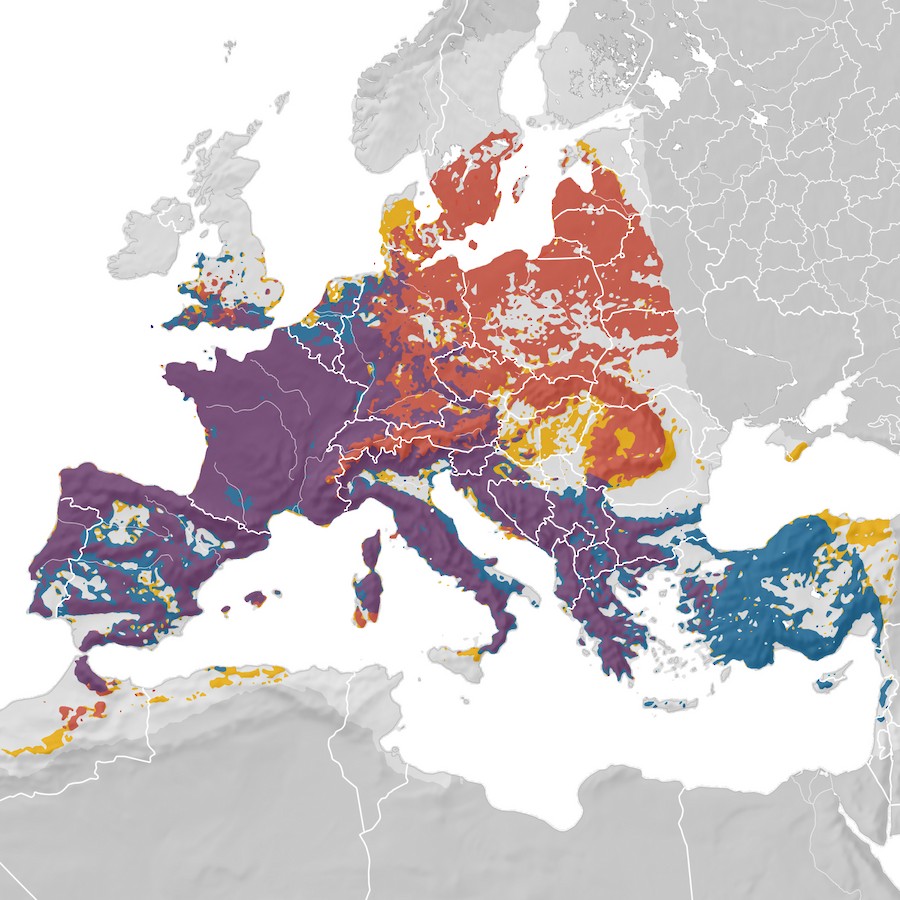
מפות תפוצה
הכירו את מפת התפוצה החדשה והמשופרת, המבוססת על ניתוח תוצאות של תפציות eBird כדי לספק מידע מדויק יותר על תפוצת מינים. גלו עד כמה צפונה או דרומה, מזרחה או מערבה מינים מסוימים צפויים להימצא.
למדו עוד על מפות תפוצה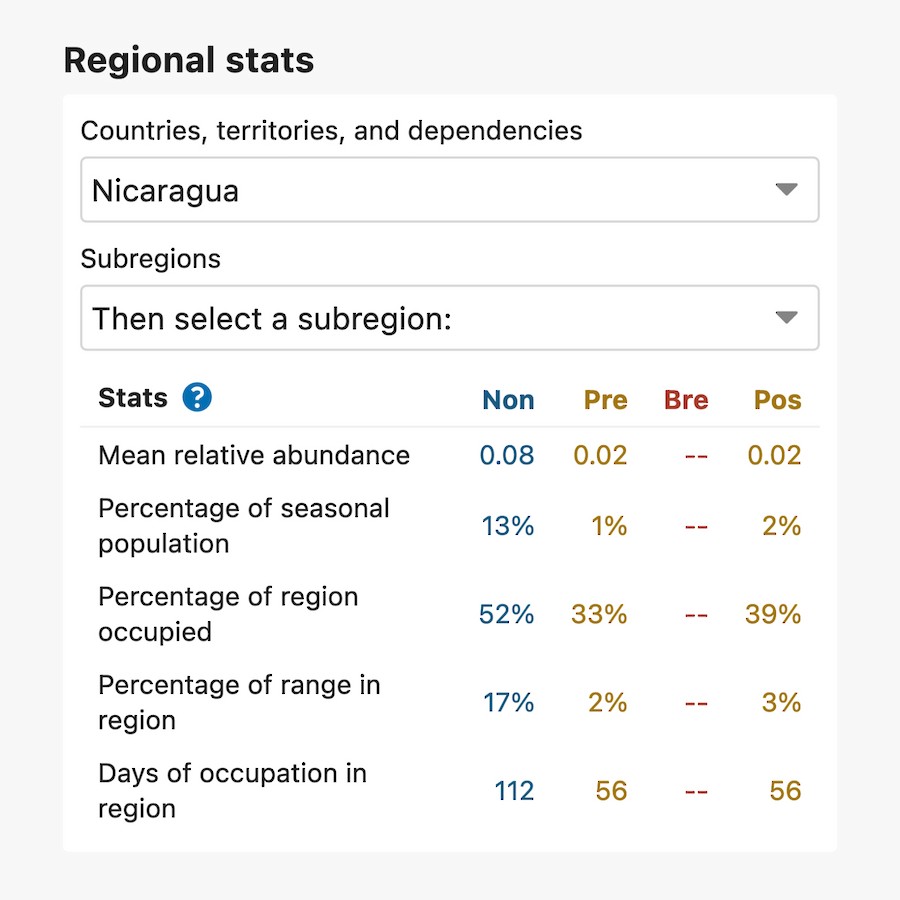
קבלו סיכום סטטיסטי לאזור או המחוז שלכם
סיכומים של שפע יחסי, אחוז מודל אוכלוסייה עונתי, ומגמות מצטברות זמינות כעת לרמת אזורים ומחוזות. בחרו את האזור המעניין אותכם וקבלו סיכום סטטיסטי המסייע לתוכניות שימור ועוד.
למדו עוד על סיכום סטטיסטיהורדת תוצרי הנתונים
תוצרי הנתונים של הסטטוסים והמגמות של eBird כוללים תפוצה מוערכת של מינים, שפע, וקשרים סביבתיים. תוצרי הנתונים מאחורי ההדמיות זמינים לציבור לאחר שישה חודשים מרגע העלאת ההדמיה לאתר (הערה: כתוצאה מכך נוצר פער של שישה חודשים). תוצרי הנתונים זמינים דרך תופס בקשת גישה וזמינים להורדה בעזרת R package. לבקשת גישה לתצורי הנתונים, הורידו טבלאות טווח ושפע אזוריים או מפות תפוצה מרחביות האחרונות, ועקבו אחר הלינק למטה.
הורדת תוצרי הנתוניםThe new data-driven maps and animations are made possible through support from the National Science Foundation, Wolf Creek Charitable Foundation, Leon Levy Foundation, NASA, Amazon Web Services, Institute for Computational Sustainability, and the NSF Advanced Cyberinfrastructure Coordination Ecosystem: Services & Support (ACCESS) program.
Supporters
