Products


Ugaritasuna
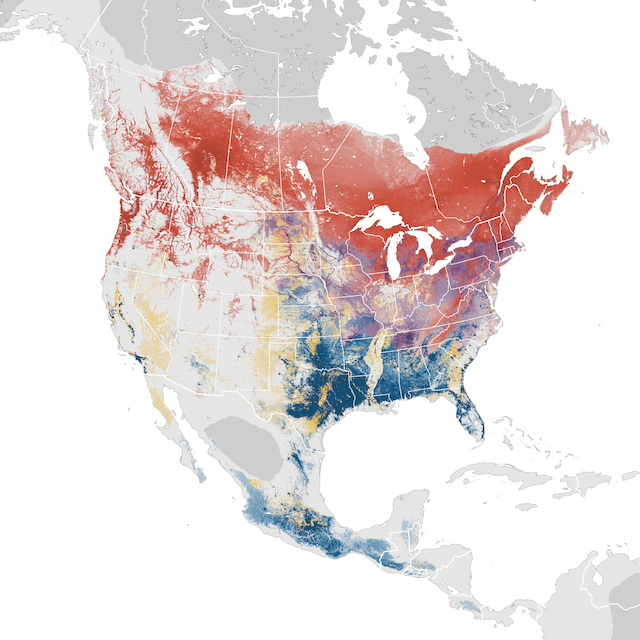
Relative abundance is depicted for each season along a color gradient from a light color indicating lower relative abundance to a dark color indicating a higher relative abundance. Relative abundance is the estimated average count of individuals detected by an eBirder during a 1 hour, 2 kilometer traveling checklist at the optimal time of day for each species.
Gehiago ikasiUrtean zehar
0.161.76
Ugalketa sasoia
21 eka. - 9 abu.
0.161.76
Ugalketa sasoitik kanpo
27 abe. - 29 mar.
0.161.76
Ugalketa aurreko migrazio sasoia
5 api. - 14 eka.
0.161.76
Ugalketa osteko migrazio sasoia
16 abu. - 20 abe.
0.161.76
Urtaroak
uomameuaiuaa
