
Habitat regional charts
Habitat regional charts show the types of habitat species are associated with every week of the year for countries, territories, and dependencies as well as subregions within each country, territory, or dependency. These charts provide a unique way of visualizing the habitat variables that have been included in all of the eBird Status and Trends models. The charts help visualize how species associate with different habitat types throughout the year, expanding our knowledge base and sparking new research questions to investigate. They also allow researchers, land managers, and decision-makers to identify the important habitats that support species in different places and at different times of the year.
How to interpret the habitat regional charts
The habitat regional charts show the relative strength of birds’ association with different habitat types for the selected area for every week of the year. Colored areas above the zero-line show a positive association with habitat types, whereas colored areas below the zero-line show a negative association with habitat types (e.g. not likely to use). The thickness of each color represents the relative strength of the positive or negative association of the given habitat type. In the example below for Willow Flycatchers in Indiana, the yellowish-green color is thicker than the purple indicating that birds show the strongest association with dense herbaceous vegetation (yellowish-green) and a weaker positive association with herbaceous wetlands (purple) during the breeding season. The thick gray and black area below the horizontal indicates that Willow Flycatchers are not associated with roads and urban areas. Hovering over the chart allows you to see the relative strength of the habitat associations and how the habitat associations change every week of the year. The values in the legend describe the relative importance of the habitat type within that region for the given week. Habitat types with values less than 1% are not shown, resulting in total contributions that may sum to less than 100%.
In some species you will notice that the habitat associations become more variable and sometimes drop out completely. This happens at the edge of species’ ranges or at the beginning and end of seasons when relative abundance is low. Relative abundance is the estimated number of individuals detected by an eBirder during a traveling count at the optimal time of day for each species. To help understand when relative abundance is low, the black line over the habitat chart shows the trajectory of the weekly mean of relative abundance scaled between zero and one. Layering scaled relative abundance on top of the charts helps us determine what habitat associations most likely influence a larger proportion of individuals within a given region and time of year.
The data behind these charts are based on sightings of birds submitted by eBirders and habitat types derived from land cover data within a 1.5 km radius at the center of every eBird checklist. These habitat associations are a key output of the eBird Status models, allowing us to better estimate species distributions and relative abundance.
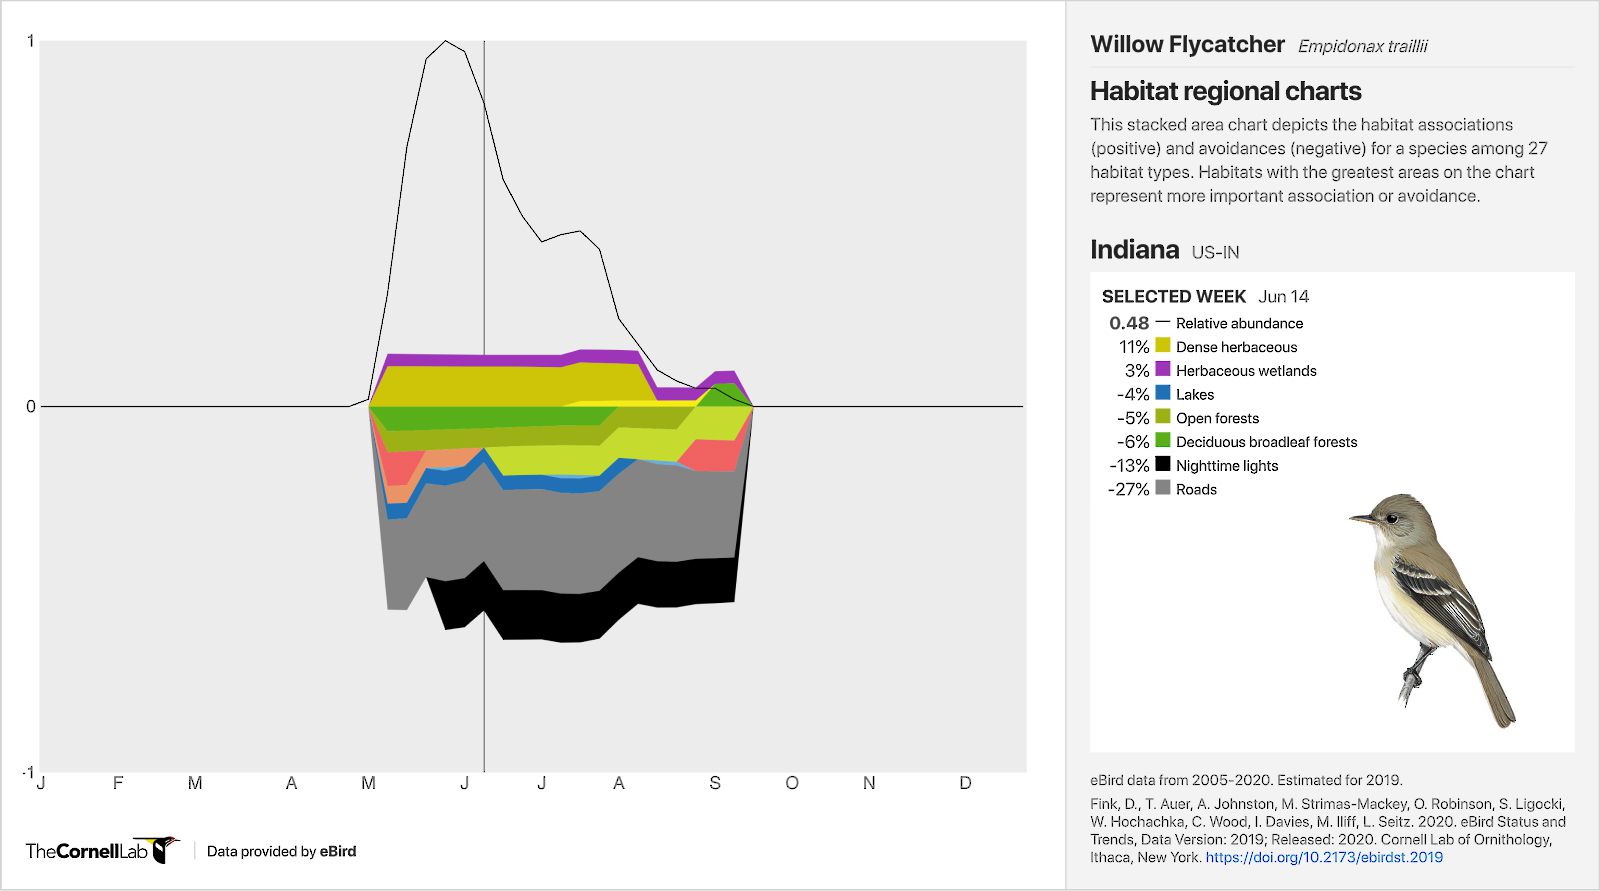
Habitat associations for Willow Flycatchers in Indiana for every week of the year. Willow Flycatchers show a positive association with dense herbaceous vegetation throughout the breeding season and a negative association with roads. Willow Flycatcher illustration by Hillary Burn © Cornell Lab of Ornithology.
What can we learn from habitat regional charts?
The relationships visualized in habitat regional charts help us see how habitat types affect the predicted relative abundance patterns displayed in eBird Status models. Twenty seven different habitat variables are taken into account when predicting occurrence and abundance in the status models, it’s just that we can’t see how habitat associations change over space and time when we look at the maps. That’s the power of the habitat regional charts, they allow us to see the changes in underlying habitat associations that drive the changes in distributions that we observe. Habitat regional charts provide researchers, land managers, and decision-makers with additional knowledge of habitat associations throughout a bird’s annual cycle to help them identify key habitats to focus their restoration or protection efforts.

Habitat associations for Wood Thrush in South Carolina for every week of the year. During the second week of May Wood Thrush are positively associated with deciduous broadleaf forests and are negatively associated with roads and nighttime lights. Wood Thrush illustration by Tim Worfolk © Cornell Lab of Ornithology.
Habitat regional charts can tell us what habitat types a species uses more or less frequently throughout the year. For example, Wood Thrush in South Carolina most frequently associate with deciduous broadleaf forests throughout the breeding and migratory seasons, suggesting that deciduous broadleaf forests are important not only for breeding individuals but for those passing through in the fall as well. Habitat charts also indicate the types of habitats a species is not associated with. Wood Thrush in South Carolina, for example, are negatively associated with nighttime lights and sparse forests. Habitat regional charts used in conjunction with the eBird Status abundance maps also highlight where the species does and does not occur within a region, providing researchers, land managers, and conservationists a with much broader look than is possible with site-specific monitoring programs alone.
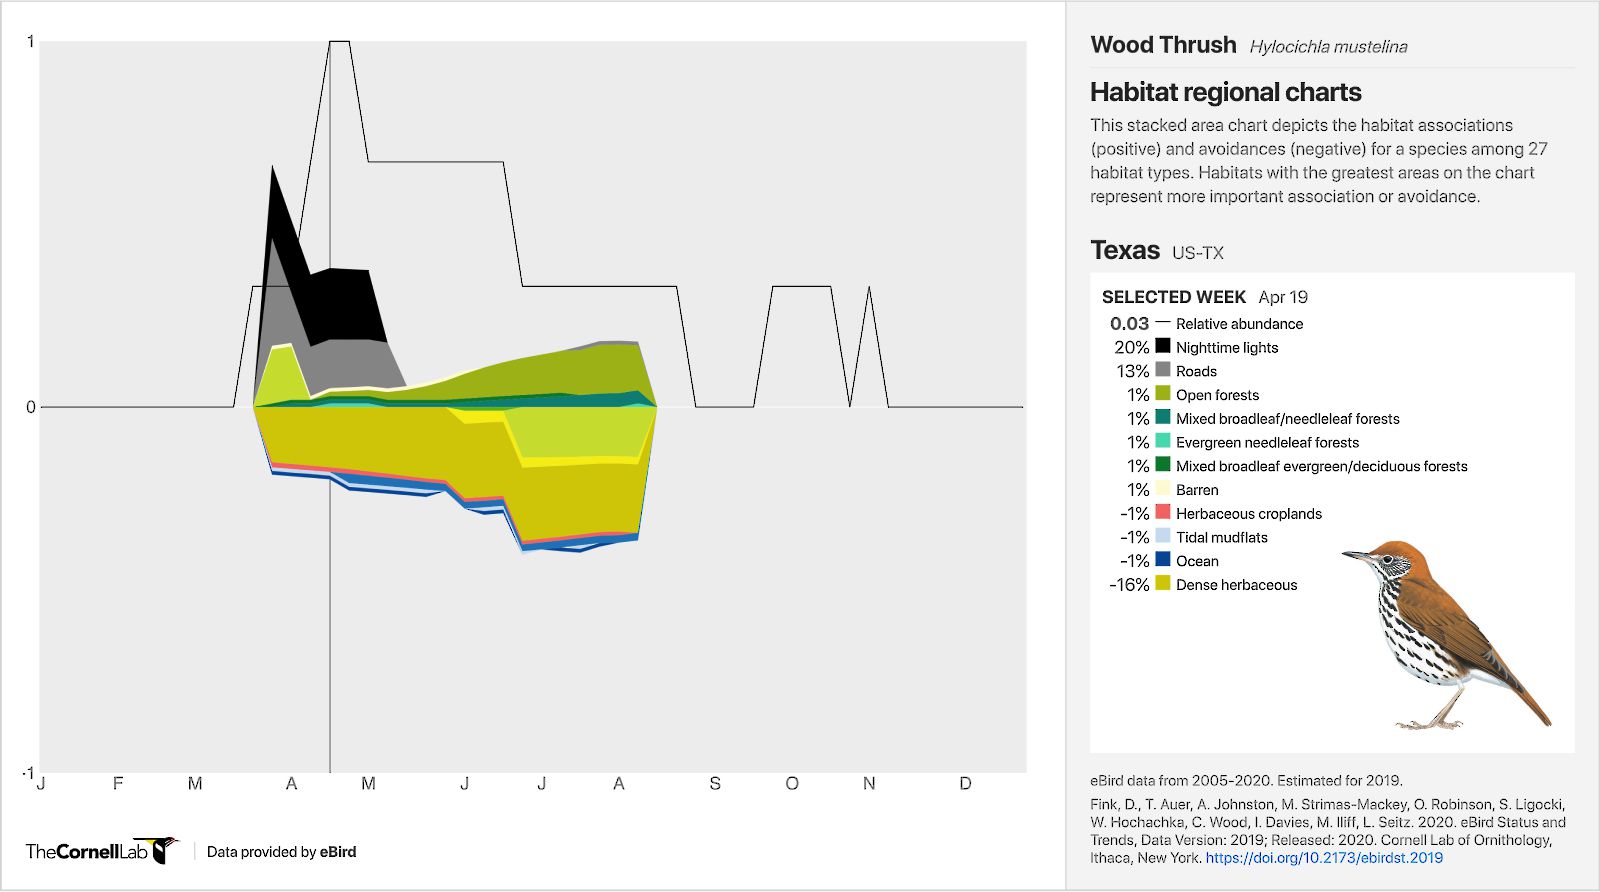
When Wood Thrush migrate through Texas in spring they show a positive association with nighttime lights and roads. Habitat regional charts provide researchers, land managers, and decision-makers with key information on habitat use that can inform conservation. Wood Thrush illustration by Tim Worfolk © Cornell Lab of Ornithology.
Habitat regional charts provide a series of snapshots of habitat associations that can help land managers and decision-makers better prioritize conservation efforts. Wood Thrush arriving in and migrating through Texas in April and May appear to be using areas dominated by nighttime lights and roads. Light attracts and disorients birds migrating at night causing confusion and exhaustion, making them vulnerable to collisions with buildings. An estimated 365 – 988 million birds die in collisions with buildings annually, including a number of species of high conservation concern. Being able to identify when species, like Wood Thrush, may be vulnerable to nighttime lights can inform lights out initiatives designed to safeguard migrating birds as they pass.
Habitat regional charts also demonstrate how the use of different habitat types change throughout space and time. Black-throated Gray Warblers, for example, are positively associated with evergreen needleleaf forests in Washington during the breeding season, but in the interior west, Black-throated Gray Warblers are positively associated with sparse forests. To provide protection for this species, conservation efforts may need to focus on multiple habitat types.
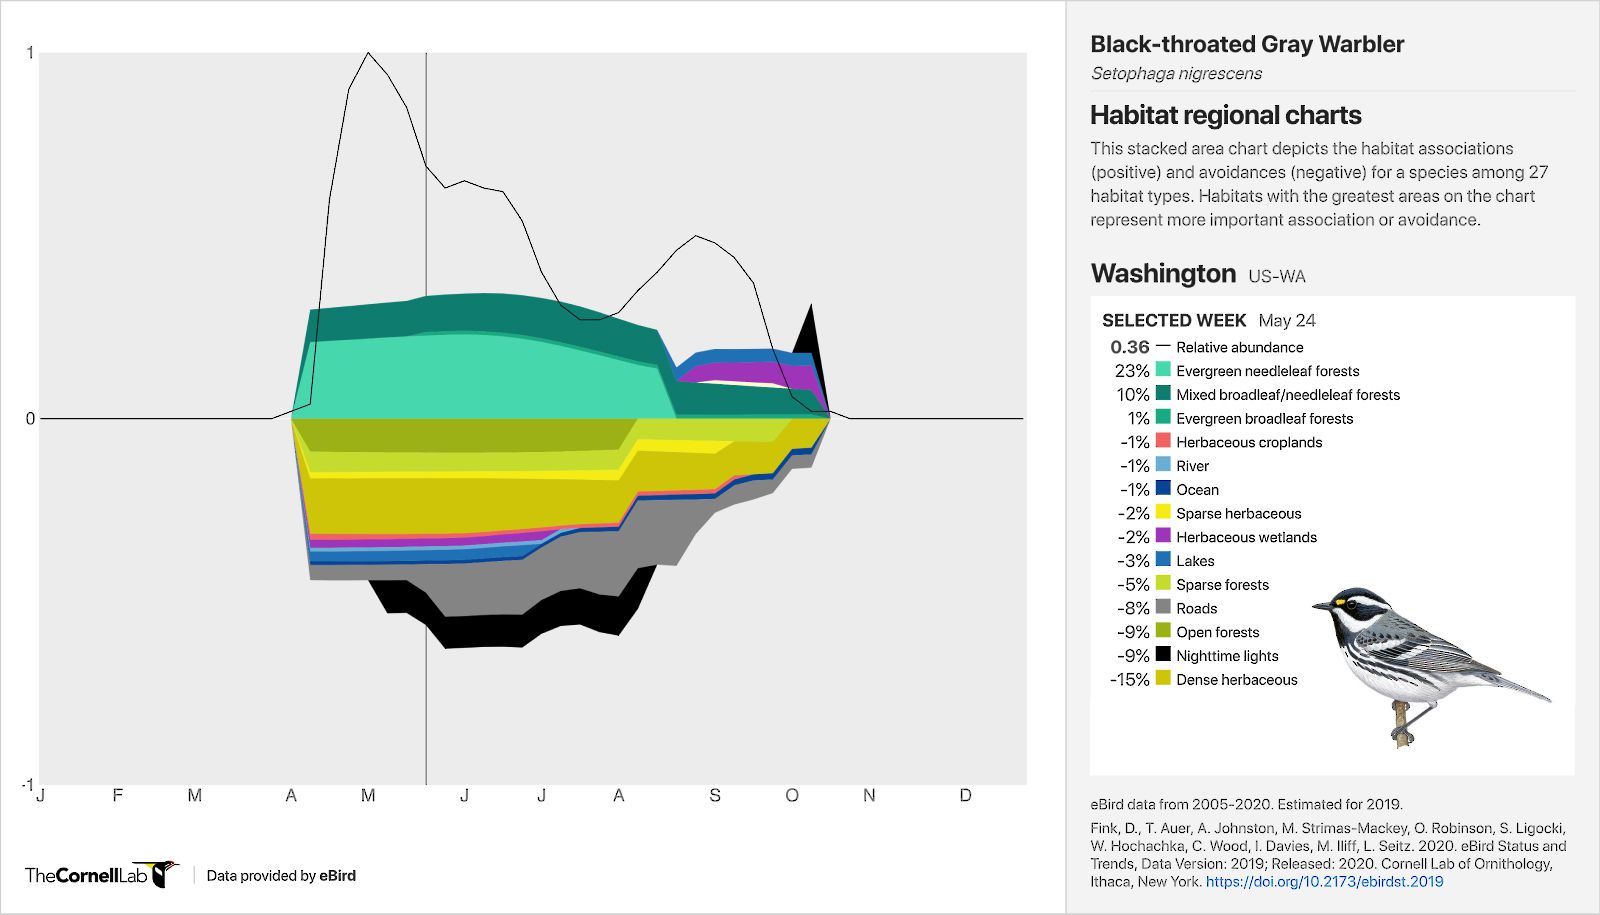
Habitat associations for Black-throated Gray Warbler in Washington for every week of the year. During the breeding season Black-throated Gray Warblers show a positive association with evergreen needleleaf forests and to a lesser extent mixed broadleaf and needleleaf forests. Black-throated Gray Warbler illustration by David Quinn © Cornell Lab of Ornithology.
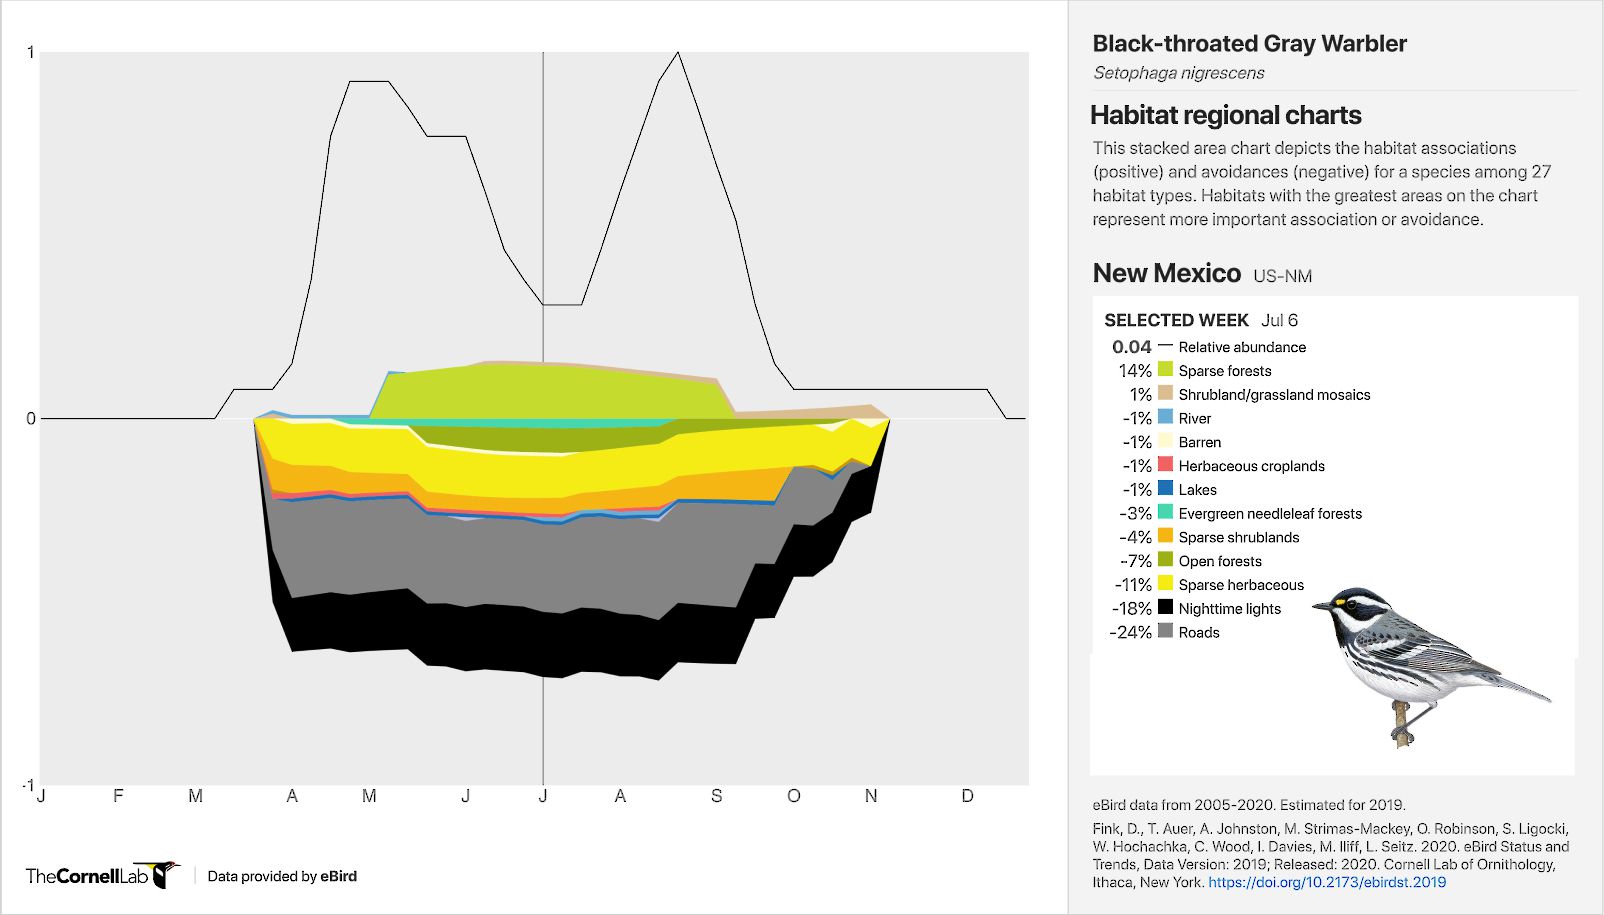
Habitat associations for Black-throated Gray Warbler in New Mexico for every week of the year. During the breeding season Black-throated Gray Warblers show a positive association with sparse forests. Black-throated Gray Warbler illustration by David Quinn © Cornell Lab of Ornithology.