Abundance Map
Cornell Lab Powered by eBird

Tallrikhet

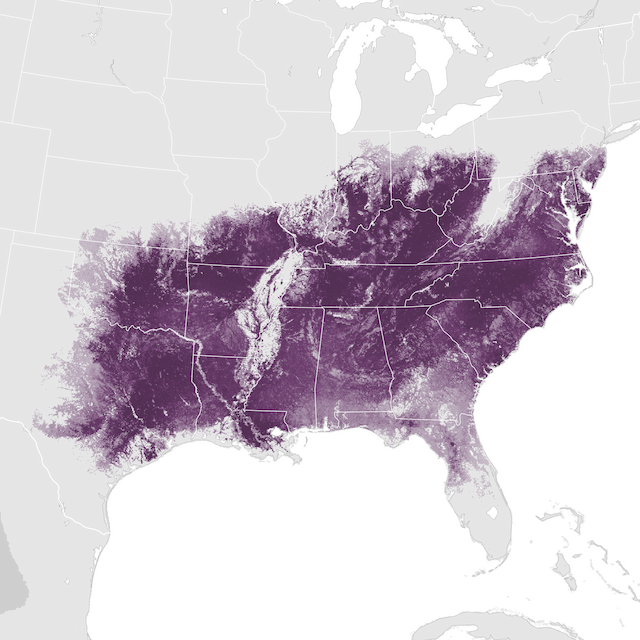
Relative abundance is depicted for each season along a color gradient from a light color indicating lower relative abundance to a dark color indicating a higher relative abundance. Relative abundance is the estimated average count of individuals detected by an eBirder during a 1 hour, 2 kilometer traveling checklist at the optimal time of day for each species.

Mer info
Hele året
0.5123.5
Layer Opacity

Regional Stats

Basemap

Modeled Area
(0 abundance)
No Prediction

eBird Data from 2008-2022. Estimated for 2022.

Fink, D., T. Auer, A. Johnston, M. Strimas-Mackey, S. Ligocki, O. Robinson, W. Hochachka, L. Jaromczyk, C. Crowley, K. Dunham, A. Stillman, I. Davies, A. Rodewald, V. Ruiz-Gutierrez, C. Wood. 2023. eBird Status and Trends, Data Version: 2022; Released: 2023. Cornell Lab of Ornithology, Ithaca, New York. https://doi.org/10.2173/ebirdst.2022