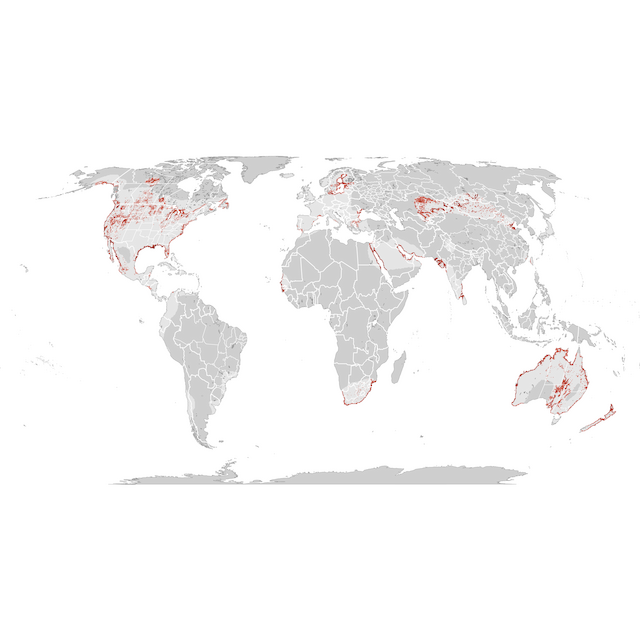
Relative abundance is depicted for each season along a color gradient from a light color indicating lower relative abundance to a dark color indicating a higher relative abundance. Relative abundance is the estimated average count of individuals detected by an eBirder during a 1 hour, 2 kilometer traveling checklist at the optimal time of day for each species.
Gehiago ikasi
Isolate Urtean zehar
0 0.03 1
Ugalketa sasoia
31 May - 12 Jul
Isolate Ugalketa sasoia
0 0.03 1
Ugalketa sasoitik kanpo
22 Nov - 1 Mar
Isolate Ugalketa sasoitik kanpo
0 0.03 1
Ugalketa aurreko migrazio sasoia
8 Mar - 24 May
Isolate Ugalketa aurreko migrazio sasoia
0 0.03 1
Ugalketa osteko migrazio sasoia
19 Jul - 15 Nov
Isolate Ugalketa osteko migrazio sasoia
0 0.03 1
Lurralde mailako estatistikak Countries, Territories, and Dependencies
Aukeratu eskualdea:
Afghanistan
Aland
Albania
Angola
Armenia
Australia
Austria
Azerbaijan
Bahamas
Bahrain
Bangladesh
Belarus
Belize
Botswana
Brunei
Bulgaria
Cambodia
Canada
Cape Verde
Cayman Islands
China
Colombia
Costa Rica
Croatia
Cuba
Czech Republic
Denmark
Djibouti
Dominican Republic
Egypt
El Salvador
England
Eritrea
Estonia
Eswatini
Ethiopia
Finland
France
Gambia
Georgia
Germany
Greece
Guatemala
Guinea
Guinea-Bissau
Haiti
Honduras
Hong Kong
Hungary
India
Indonesia
Iran
Iraq
Israel
Italy
Jamaica
Jordan
Kazakhstan
Kenya
Kuwait
Kyrgyzstan
Latvia
Lebanon
Liberia
Libya
Lithuania
Macau
Madagascar
Malaysia
Mali
Mauritania
Mexico
Moldova
Mongolia
Montenegro
Morocco
Mozambique
Myanmar
Namibia
Netherlands
New Zealand
Nicaragua
North Korea
Oman
Pakistan
Palestinian Territory
Panama
Papua New Guinea
Philippines
Poland
Portugal
Qatar
Romania
Russia
Saint Pierre and Miquelon
Saudi Arabia
Senegal
Serbia
Sierra Leone
Slovakia
Somalia
Somaliland
South Africa
South Korea
Spain
Spratly Islands
Sri Lanka
Sudan
Sweden
Switzerland
Syria
Taiwan
Tajikistan
Tanzania
Thailand
Tunisia
Turkey
Turkmenistan
Turks and Caicos Islands
Ukraine
United Arab Emirates
United States
Uzbekistan
Venezuela
Vietnam
Western Sahara
Yemen
Zimbabwe
Herrialdeak
Ondoren, aukeratu inguruan:
Custom Shapes Stats Options No Shapes Drawn on Map
Draw a shape on the map to generate a summary table or chart for that custom area of interest.
Draw Shape Export Data