
Range Maps
The Status and Trends range maps show a species’ range in each season stacked on top of each other to illustrate the boundaries of a species—how far east or west or north or south a species is known to occur throughout the year. These range maps are based on analytical results powered by eBird sightings and are light years ahead of the range maps found in traditional field guides that provide a coarse overview of a species’ range. Before citizen science projects, such as eBird, ornithologists relied on expert opinion to create range maps for field guides. While the experts consulted knew a lot about when and where each species occurred, they could not be everywhere. Now thanks to eBirders who have shared their sightings of birds around the world and new statistical modeling techniques, range maps are more accurate than ever.
Fork-tailed Flycatchers sally over grasslands and open areas from southern Mexico to Argentina. Traditional range maps show these dramatic birds occurring throughout much of the Amazon during the non-breeding season. But the new analytical range maps show that Fork-tailed Flycatchers only migrate through the Amazon and instead use open areas along the Amazon River and its tributaries year-round.
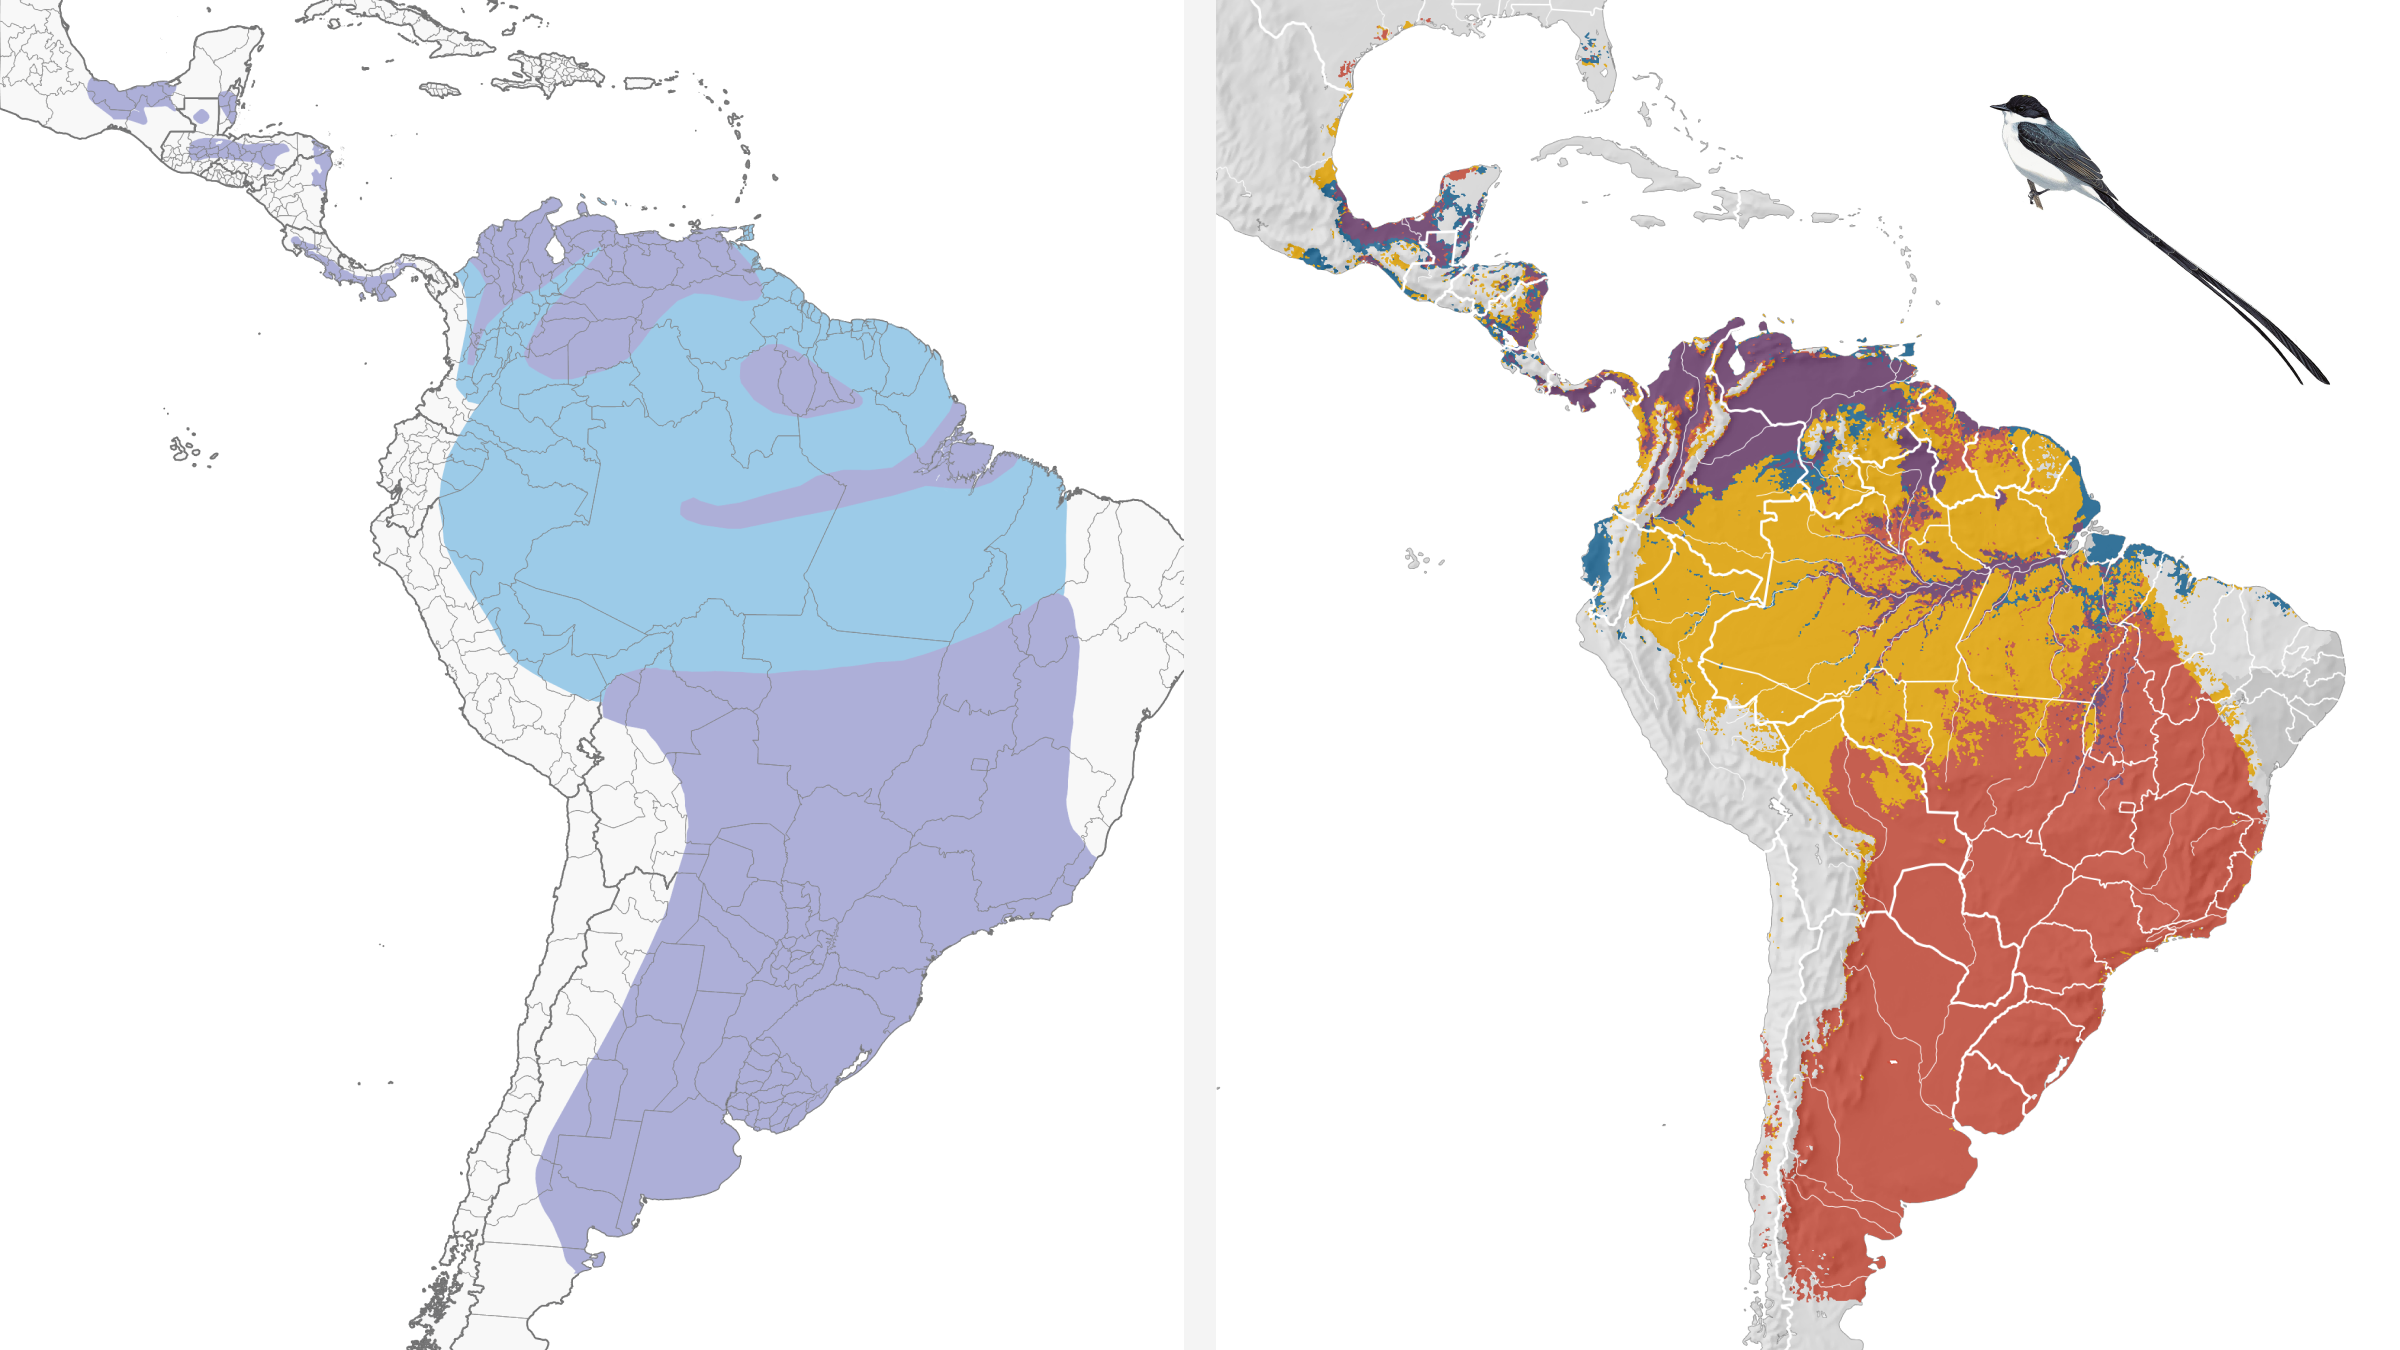
Left: Fork-tailed Flycatcher range map from Birds of the World. Blue indicates non-breeding and purple indicates year-round. Right: range map based on analytical results powered by eBird sightings. Purple indicates locations where the species is present year-round, red indicates the breeding season, blue indicates the non-breeding season, and yellow indicates locations where the species is present during the pre-breeding and post-breeding seasons. Areas of light gray indicate species absence (or very rare occurrence). Areas of darker gray indicate areas in which predictions could not be made due to a lack of data. Fork-tailed Flycatcher illustration © Ian Lewington/Lynx Edicions
The analytical powered range maps also highlight patterns across the entire species’ range. The Common Firecrest spans all of Europe to Asia Minor and Northern Africa. These new range maps reveal fine-scale relationships with topography and emphasize seasonal patterns of occurrence in great detail.
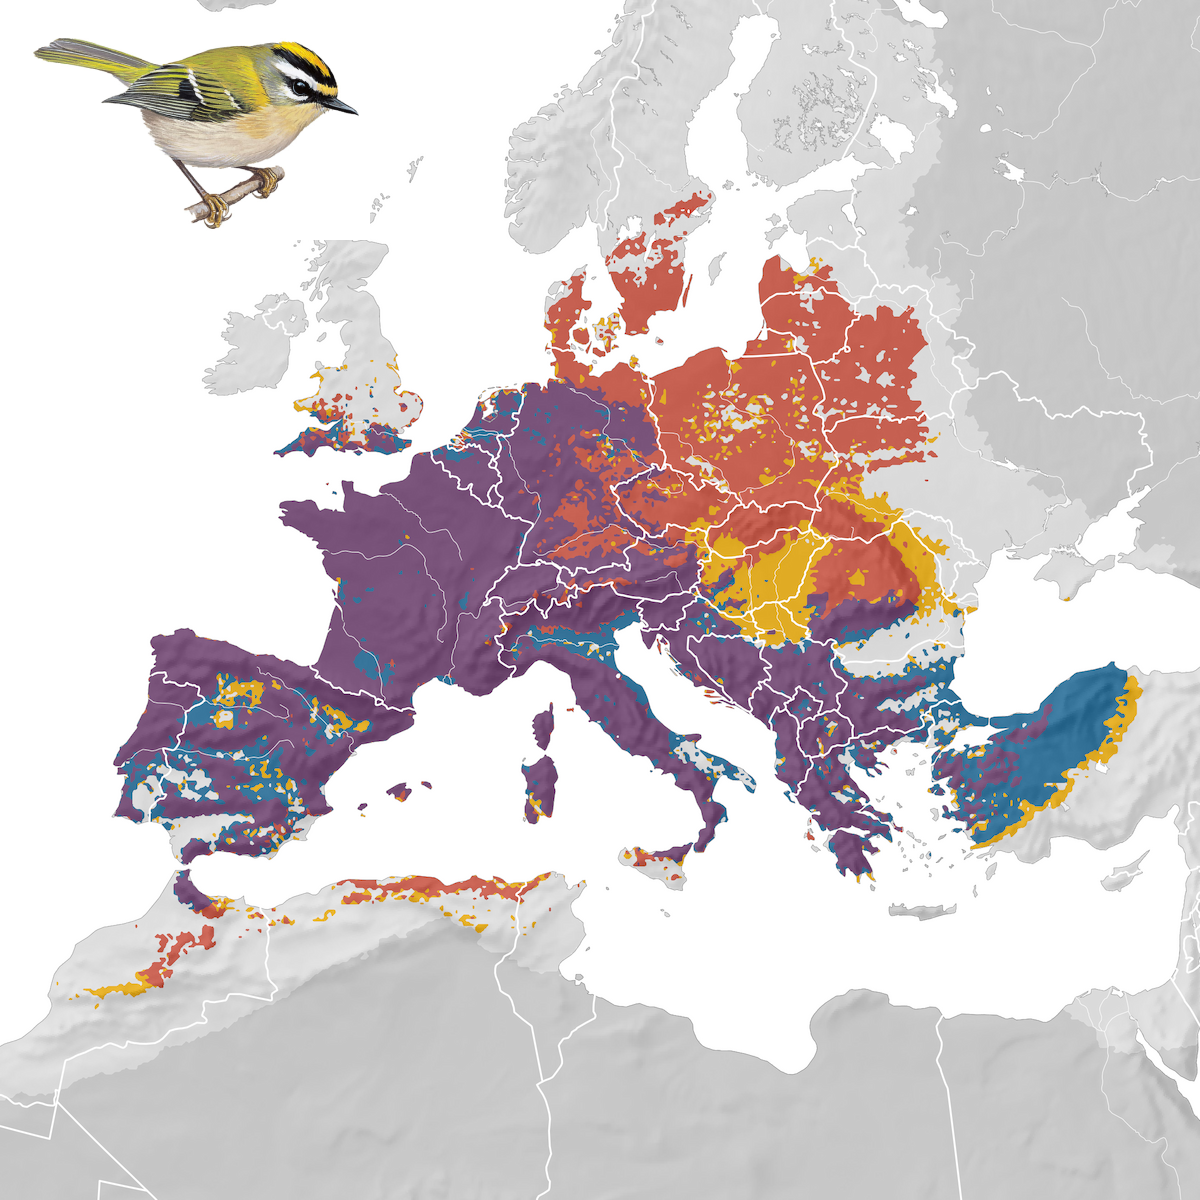
Range map of the Common Firecrest depicting the boundary of the species range, defined as the areas where the species is estimated to occur within at least one week within each season. Purple indicates locations where the species is present year-round, red indicates the breeding season, blue indicates the non-breeding season, and yellow indicates locations where the species is present during the pre-breeding and post-breeding seasons. Areas of light gray indicate species absence (or very rare occurrence). Areas of darker gray indicate areas in which predictions could not be made due to a lack of data. Common Firecrest illustration © Hilary Burn/Lynx Edicions
Range maps powered by eBird data can also be used to improve your birding. Not only do these maps help you find out when and where to go looking for your favorite bird, they also show you the extent of a species range throughout the year. A good reminder that your favorite birds are not only affected by actions in your backyard but also by what happens in locations where they stop during migration and on the wintering grounds.
Map key
The range map depicts the boundary of the species’ range, defined as the areas where the species is estimated to occur within at least one week within each season. Purple indicates locations where the species is present year-round, red indicates the breeding season, blue indicates the non-breeding season, and yellow indicates locations where the species is present during the pre-breeding and post-breeding seasons. Areas of light gray indicate species absence (or very rare occurrence). Areas of darker gray indicate areas in which predictions could not be made due to a lack of data.