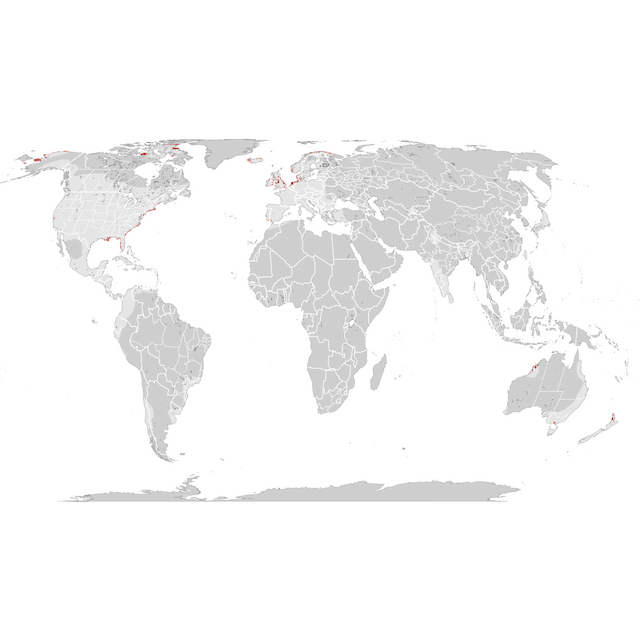
Relative abundance is depicted for each season along a color gradient from a light color indicating lower relative abundance to a dark color indicating a higher relative abundance. Relative abundance is the estimated average count of individuals detected by an eBirder during a 1 hour, 2 kilometer traveling checklist at the optimal time of day for each species.
Mer info
Isolate Hele året
0 0.06 3.4
Breeding Season
21. jun - 28. jun
Isolate Breeding Season
0 0.06 3.4
Non-breeding Season
13. des - 29. mar
Isolate Non-breeding Season
0 0.06 3.4
Pre-breeding Migratory Season
5. apr - 14. jun
Isolate Pre-breeding Migratory Season
0 0.06 3.4
Post-breeding Migratory Season
5. jul - 6. des
Isolate Post-breeding Migratory Season
0 0.06 3.4
Regional Stats Countries, Territories, and Dependencies
Velg en region:
Aland
Albania
Argentina
Aruba
Australia
Austria
Bahamas
Barbados
Belarus
Belgium
Belize
Bosnia and Herzegovina
Brazil
Brunei
Bulgaria
Cambodia
Canada
Cape Verde
Chile
China
Colombia
Costa Rica
Croatia
Cuba
Curaçao
Czech Republic
Denmark
El Salvador
England
Estonia
Faroe Islands
Finland
France
French Guiana
Gambia
Germany
Greece
Greenland
Guernsey
Guinea
Guinea-Bissau
Guyana
Honduras
Hong Kong
Hungary
Iceland
Indonesia
Ireland
Isle of Man
Israel
Italy
Japan
Jersey
Latvia
Lithuania
Malaysia
Mauritania
Mexico
Moldova
Montenegro
Morocco
Namibia
Netherlands
New Zealand
Nicaragua
North Korea
Northern Ireland
Norway
Panama
Philippines
Poland
Portugal
Puerto Rico
Romania
Russia
Saint Pierre and Miquelon
Scotland
Senegal
Serbia
Sierra Leone
Slovakia
South Africa
South Korea
Spain
Spratly Islands
Suriname
Sweden
Switzerland
Taiwan
Thailand
Trinidad and Tobago
Turkey
Turks and Caicos Islands
Ukraine
United States
Uruguay
Venezuela
Vietnam
Wales
Western Sahara
Land
Velg så et delområde:
Custom Shapes Stats Options No Shapes Drawn on Map
Draw a shape on the map to generate a summary table or chart for that custom area of interest.
Draw Shape Export Data