


Statistiques régionales

Razorbill © Keenan Yakola / Macaulay Library
Regional stats summaries are available for abundance Status data products and Trends data products.
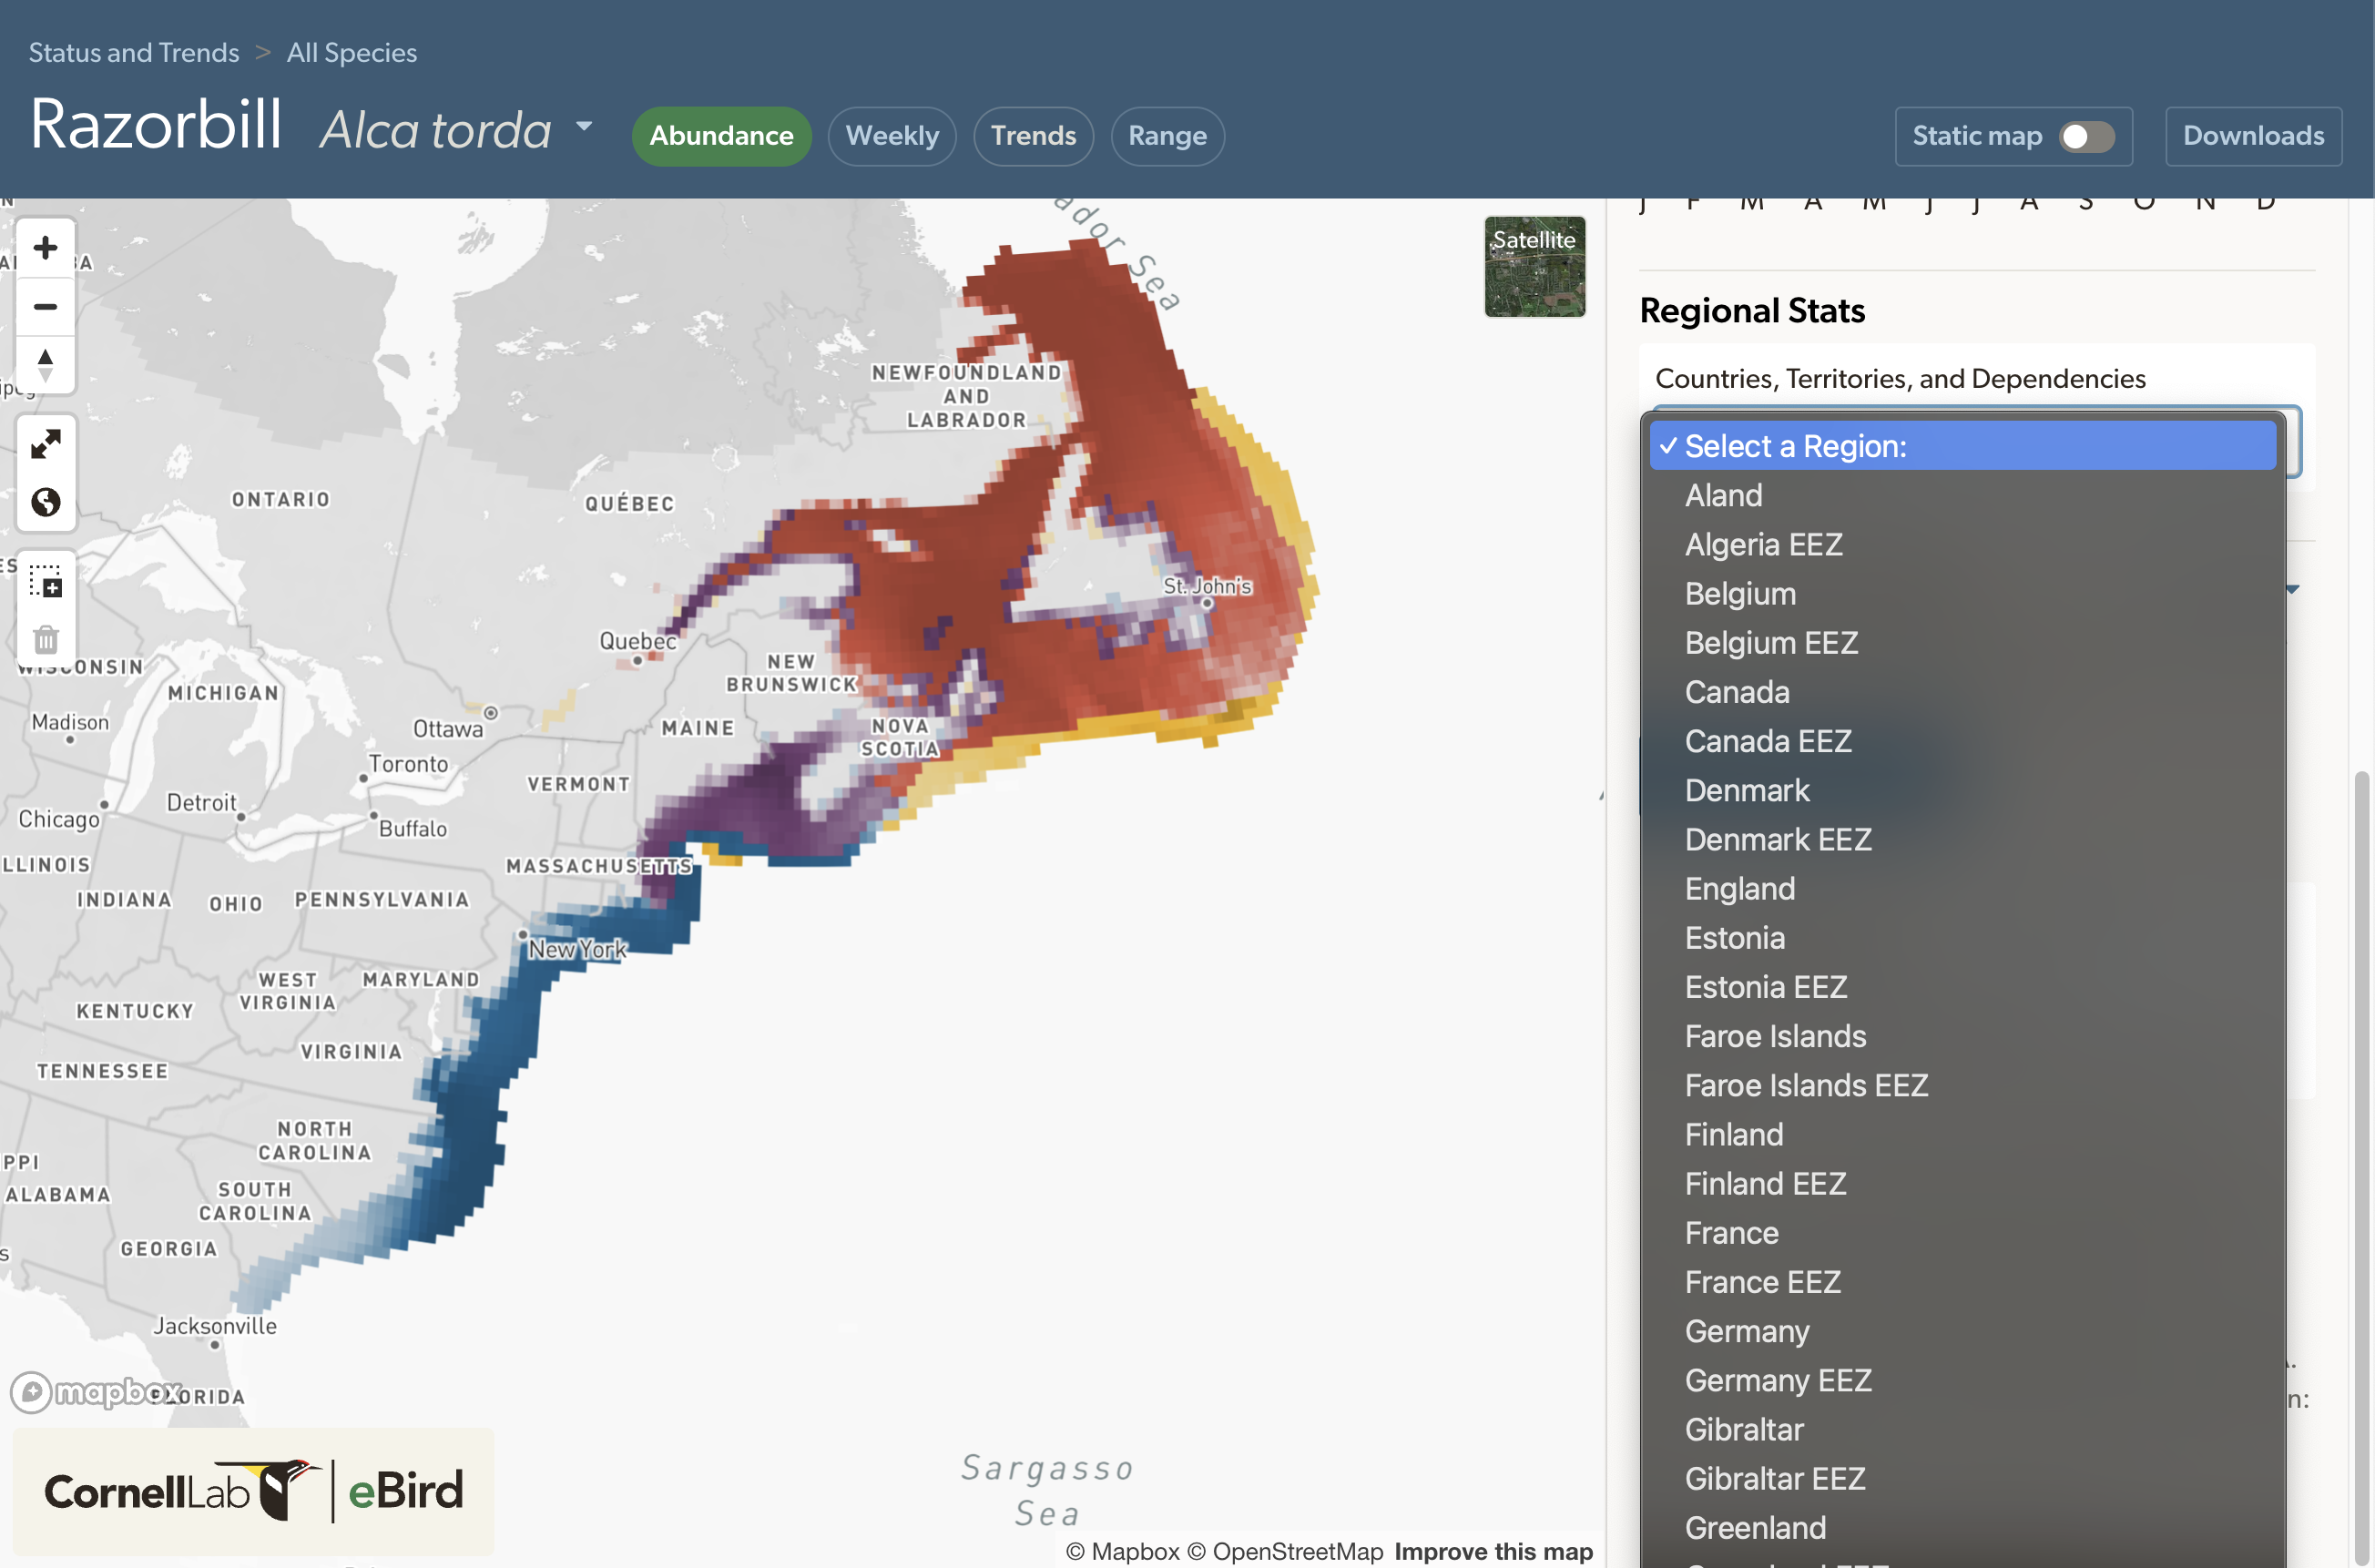
Relative abundance regional summaries
Relative abundance regional summaries are a great way to learn about what percentage of the population occurs in each country or territory and/or specific subregions throughout the year. For marine species, Economic Exclusive Zones are additional regions available for selection. Not only can this information help you find more birds, the regional stats summaries can quickly pinpoint the states and regions critical for conservation.
From the drop-down menu on the right side panel, select the primary region of interest and then select a subregion if desired. Regional summaries will populate for each season: nonbreeding, pre-breeding migration, breeding, and post-breeding migration.
Mean relative abundance is the average estimated relative abundance within the selected region for a given season.
Percent of seasonal modeled population is calculated as the sum of the estimated relative abundance within the selected region divided by the sum of the estimated relative abundance across the world, given that a majority of a species’ entire range has been modeled for a particular season.
Percent of modeled continental population is the proportion of the continental relative abundance that is present in the selected region.
Percent of region occupied is the percentage of the selected region within the range boundary of a species for a given season, given that a majority of that species’ entire range has been modeled for a particular season.
Percent of modeled range in region is calculated as the fraction of a species’ total range that falls within the selected region, given that a majority of that species’ entire range has been modeled for a particular season.
Days of occupation in region is calculated as the number of days that a species occupies the selected region, with occupation being defined as spatially covering the selected region by at least 5% based on estimated relative abundances averaged across the given season.
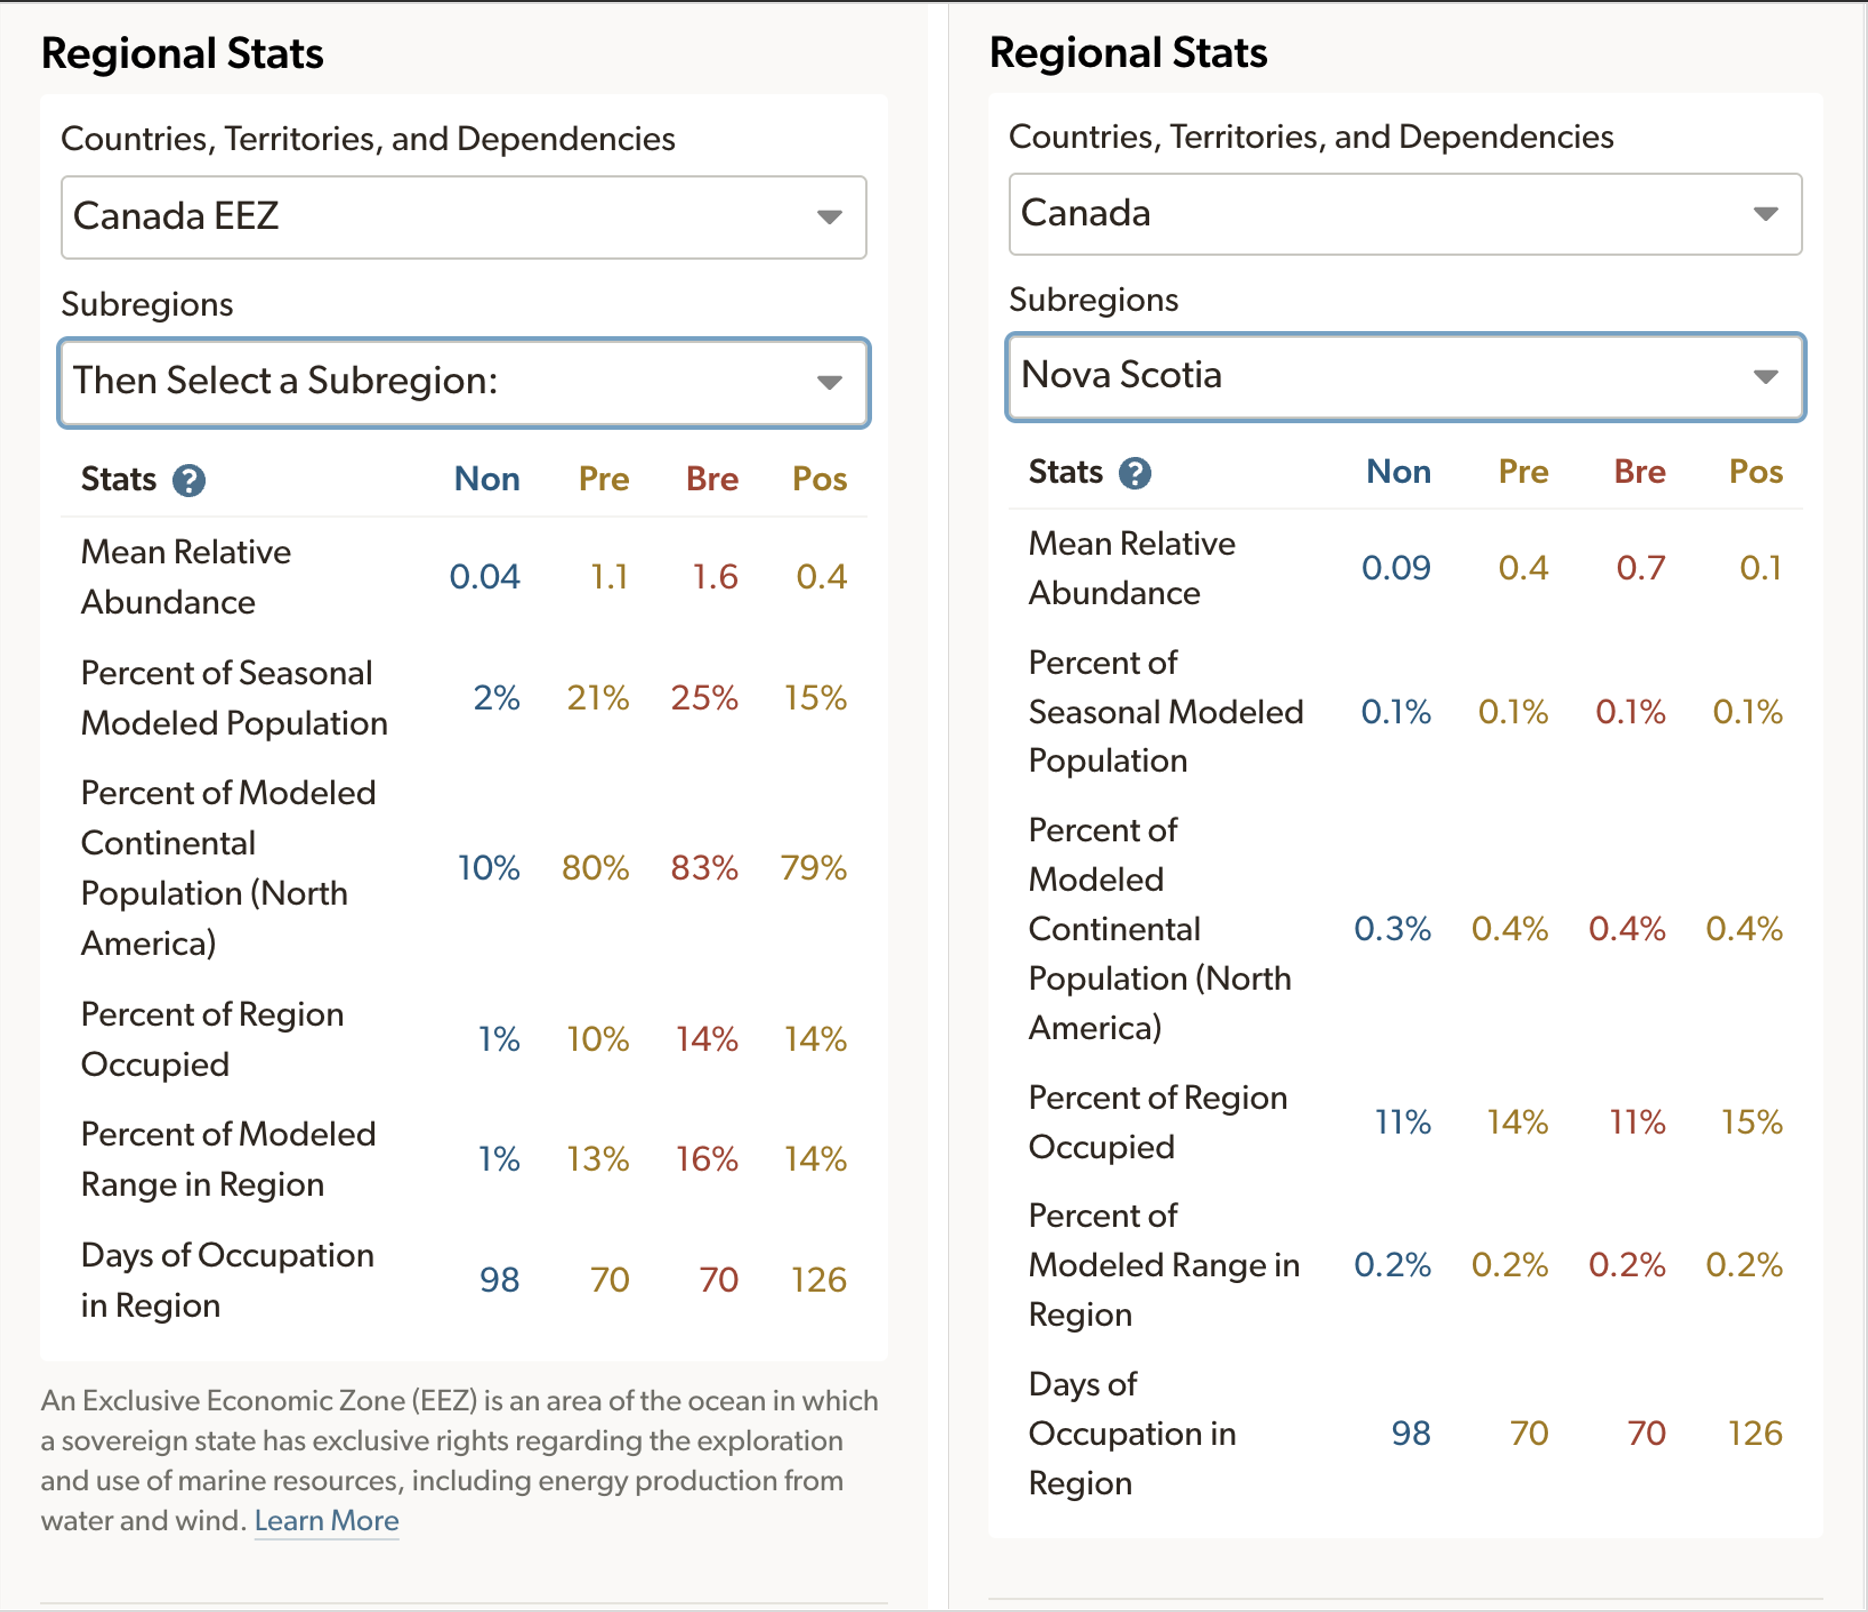
Regional relative abundance numbers for Razorbill in Canada’s Economic Exclusion Zone (left) and in Nova Scotia, Canada (right).
Trends regional summaries

Baltimore Oriole © Brad Imhoff / Macaulay Library
Regional trends summaries provide an estimate of the cumulative change in estimated relative abundance from specified years with circles representing 27km x 27km regions. Select regions of interest from the right hand side panel to see estimates of the cumulative change for the region of interest. Each estimate also includes a 80% confidence interval—the range of values where the model is fairly confident the true trend could be, with it being most likely near the median value.
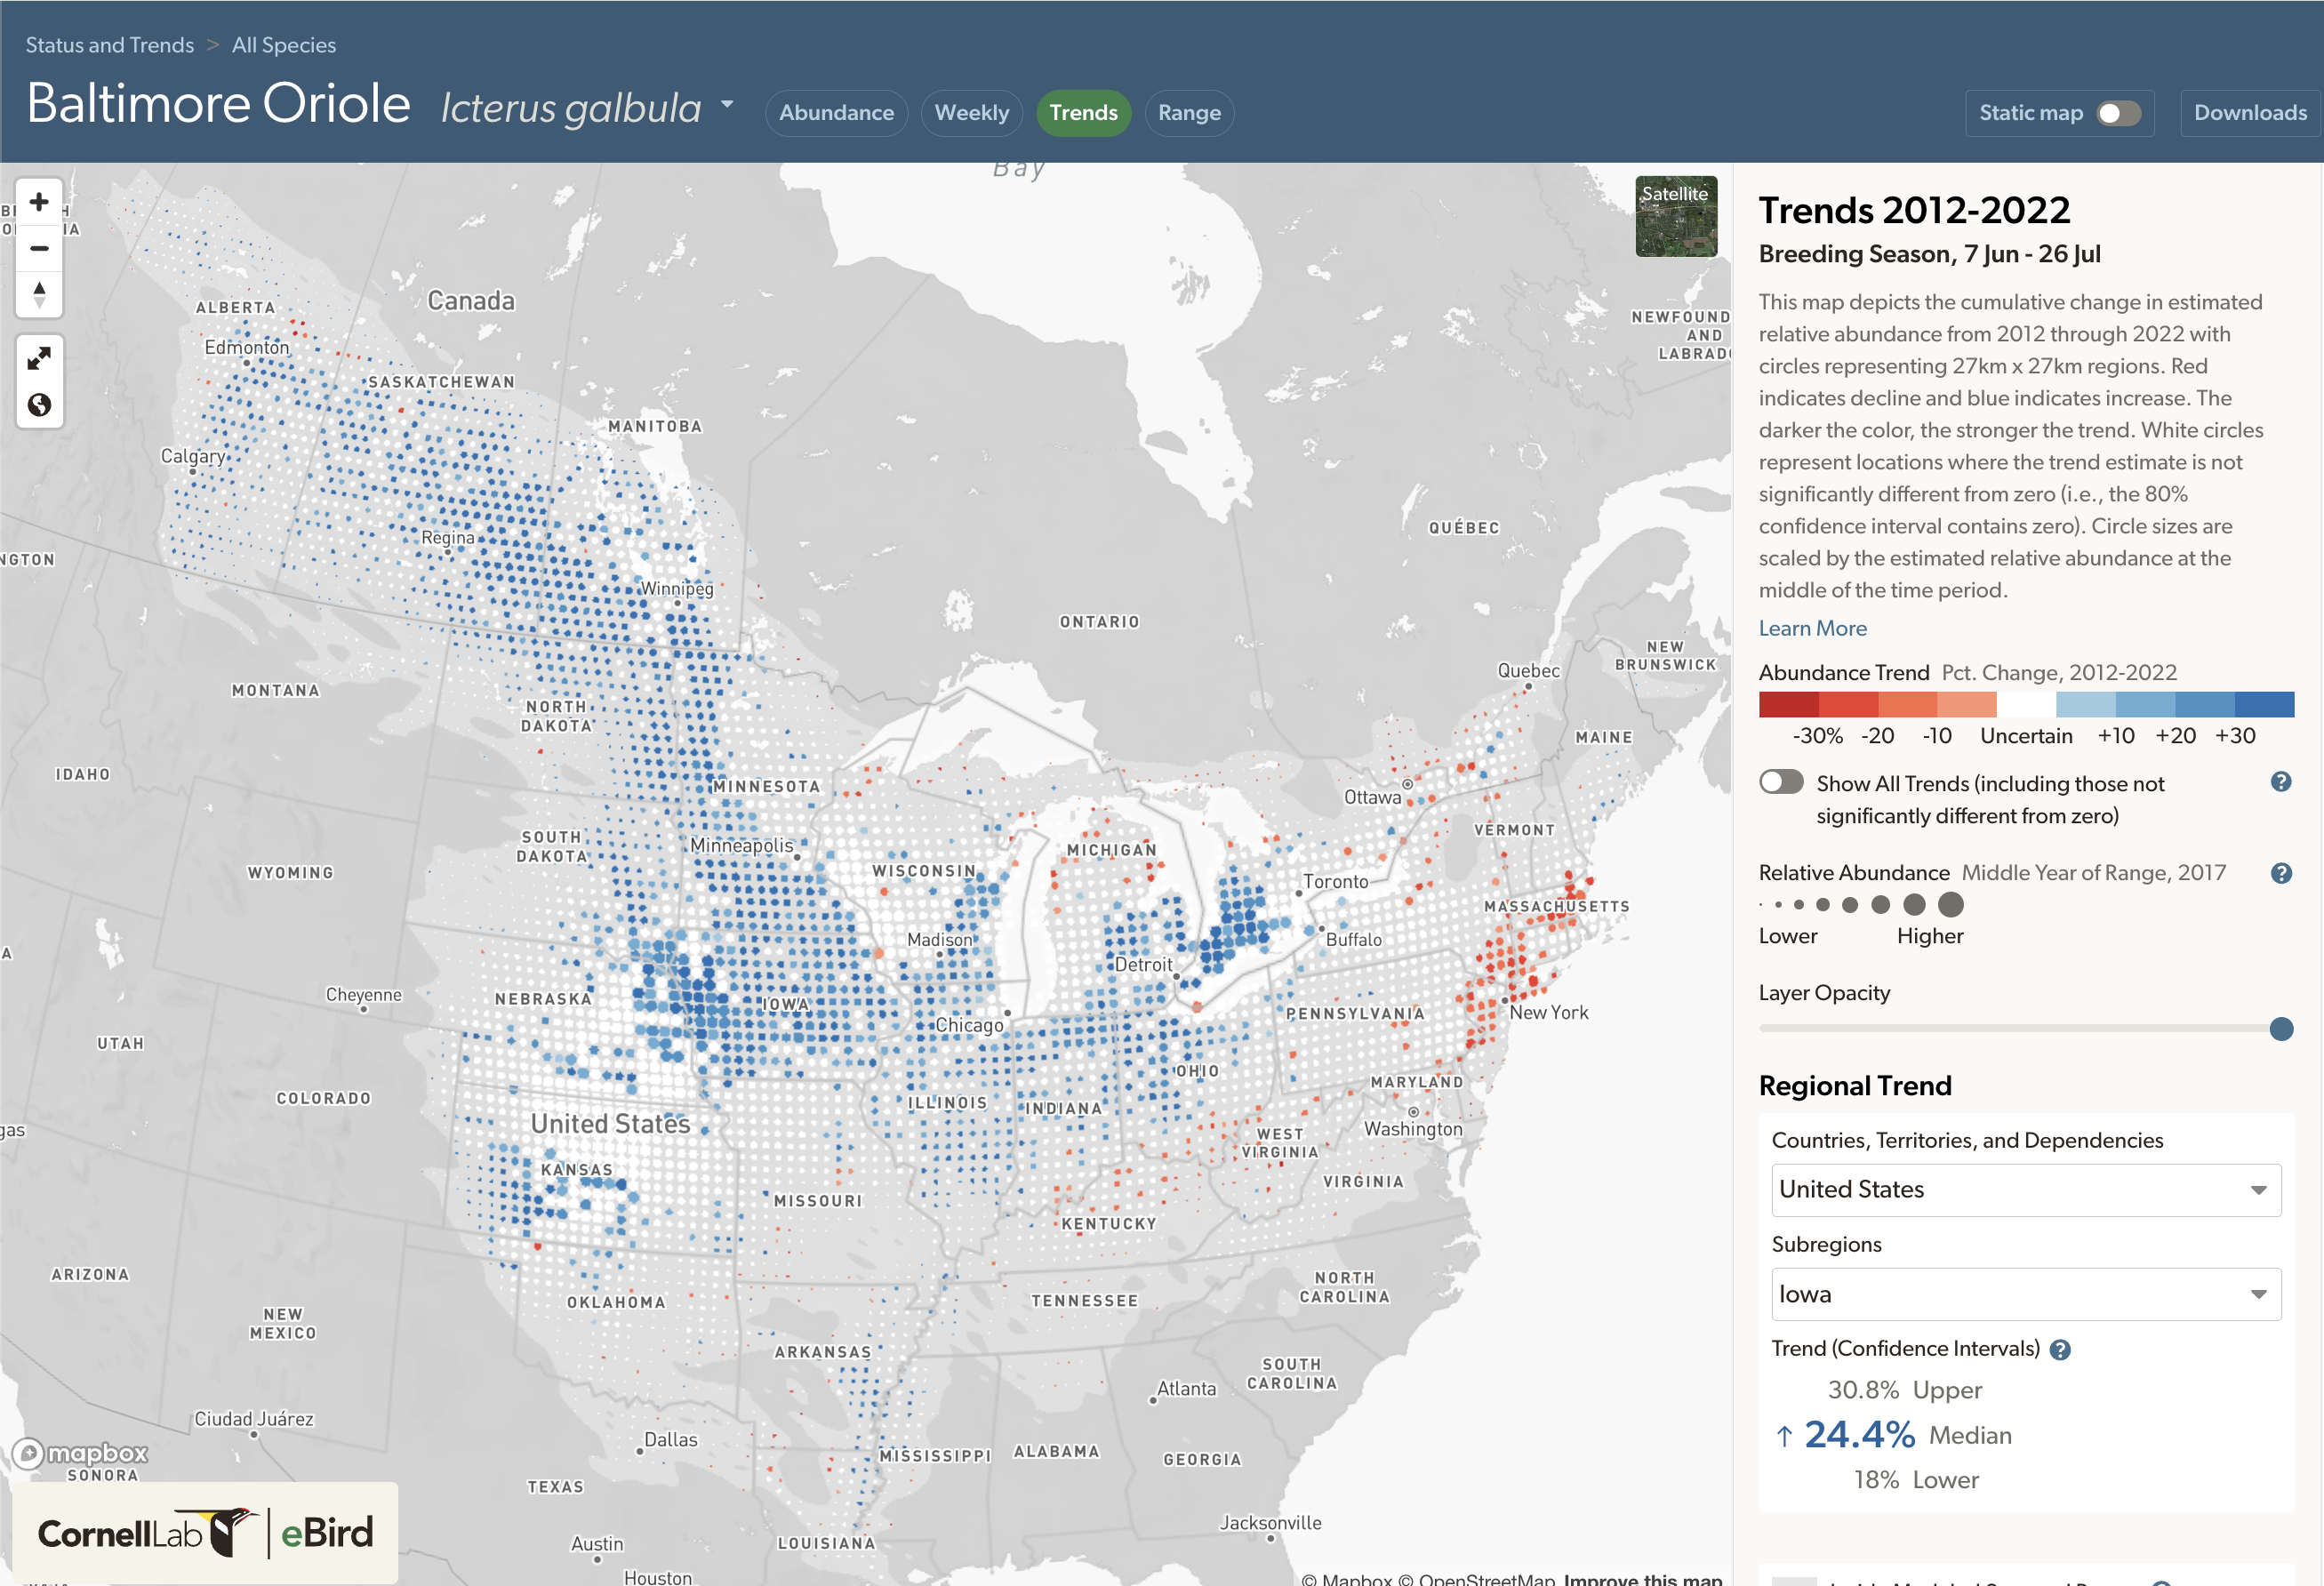
Trends for Baltimore Oriole during the breeding season in the United States from 2012-2022. Regional trend summaries for Iowa are shown in the right hand side panel.