
Mapas de abundancia
Abundance maps showcase abundance patterns throughout each season. State-of-the-art statistical models joined forces with eBird data allowing us to visualize key breeding (red), non-breeding (blue), migratory stopover areas (yellow), and year-round locations (purple) as well as areas where the species is relatively scarce. All of this information can be used to help decision-makers prioritize conservation and help you find more birds.
A study published in Science in 2019 found that nearly three billion birds have been lost since 1970. With such vast losses, identifying causes of decline is more urgent than ever. The information in these abundance maps can be used by scientists to identify locations where population strongholds occur to best prioritize conservation efforts.
Land managers at the United States Department of Agriculture (USDA), for example, used abundance maps to identify where to focus restoration efforts for the Northern Bobwhite, a game species whose population is declining.
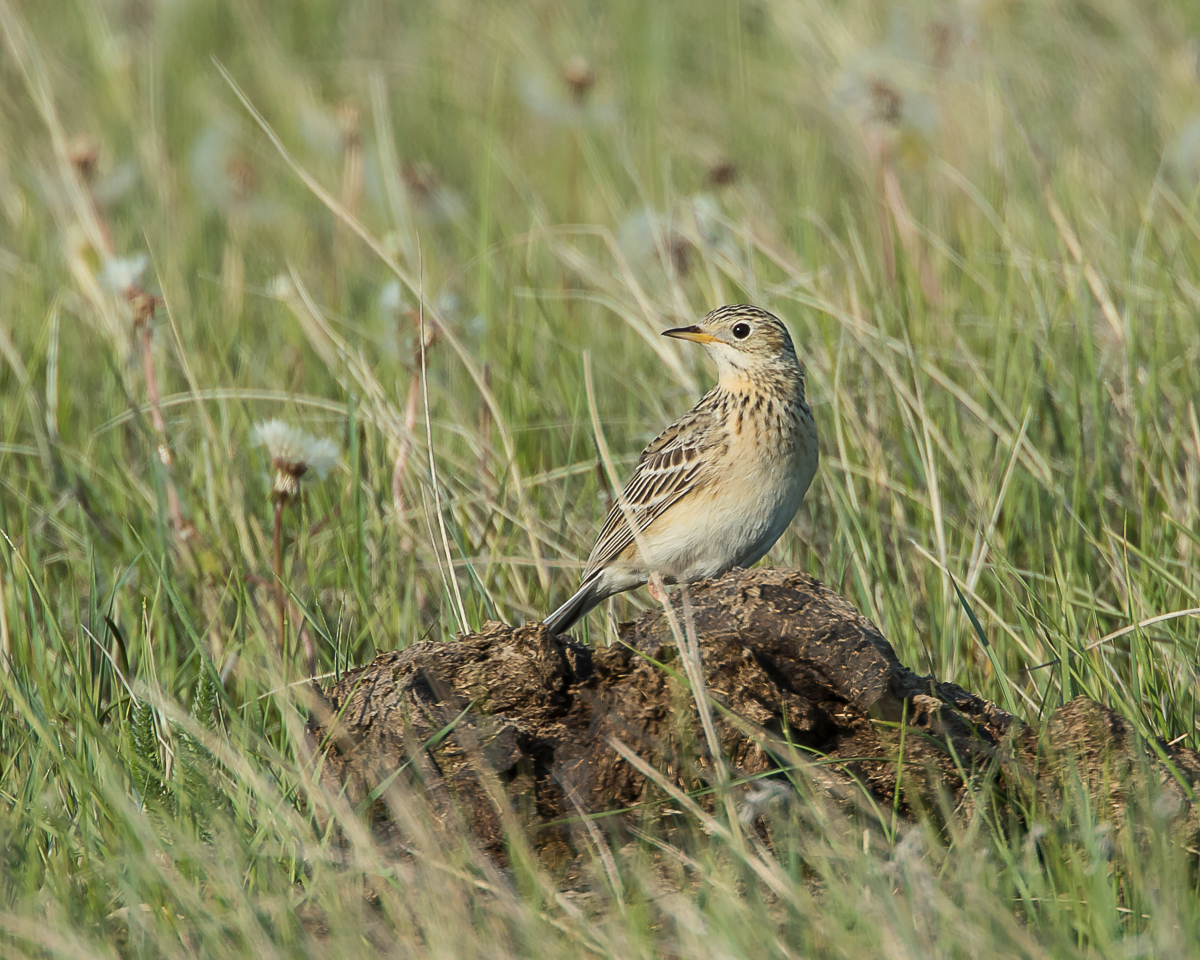
Sprague’s Pipit © Wil Hershberger/Macaulay Library
Abundance maps can also help us better understand a species’ behavior, which in turn can inform conservation efforts. Sprague’s Pipits are grassland birds whose population is rapidly declining, placing them on the International Union for the Conservation of Nature (IUCN) list of vulnerable species. Non-native plants and poor rangeland management practices create unsuitable conditions for Sprague’s Pipits. Roads that cut through their breeding areas often exacerbate the encroachment of non-native grasses further reducing habitat quality and reproductive success.
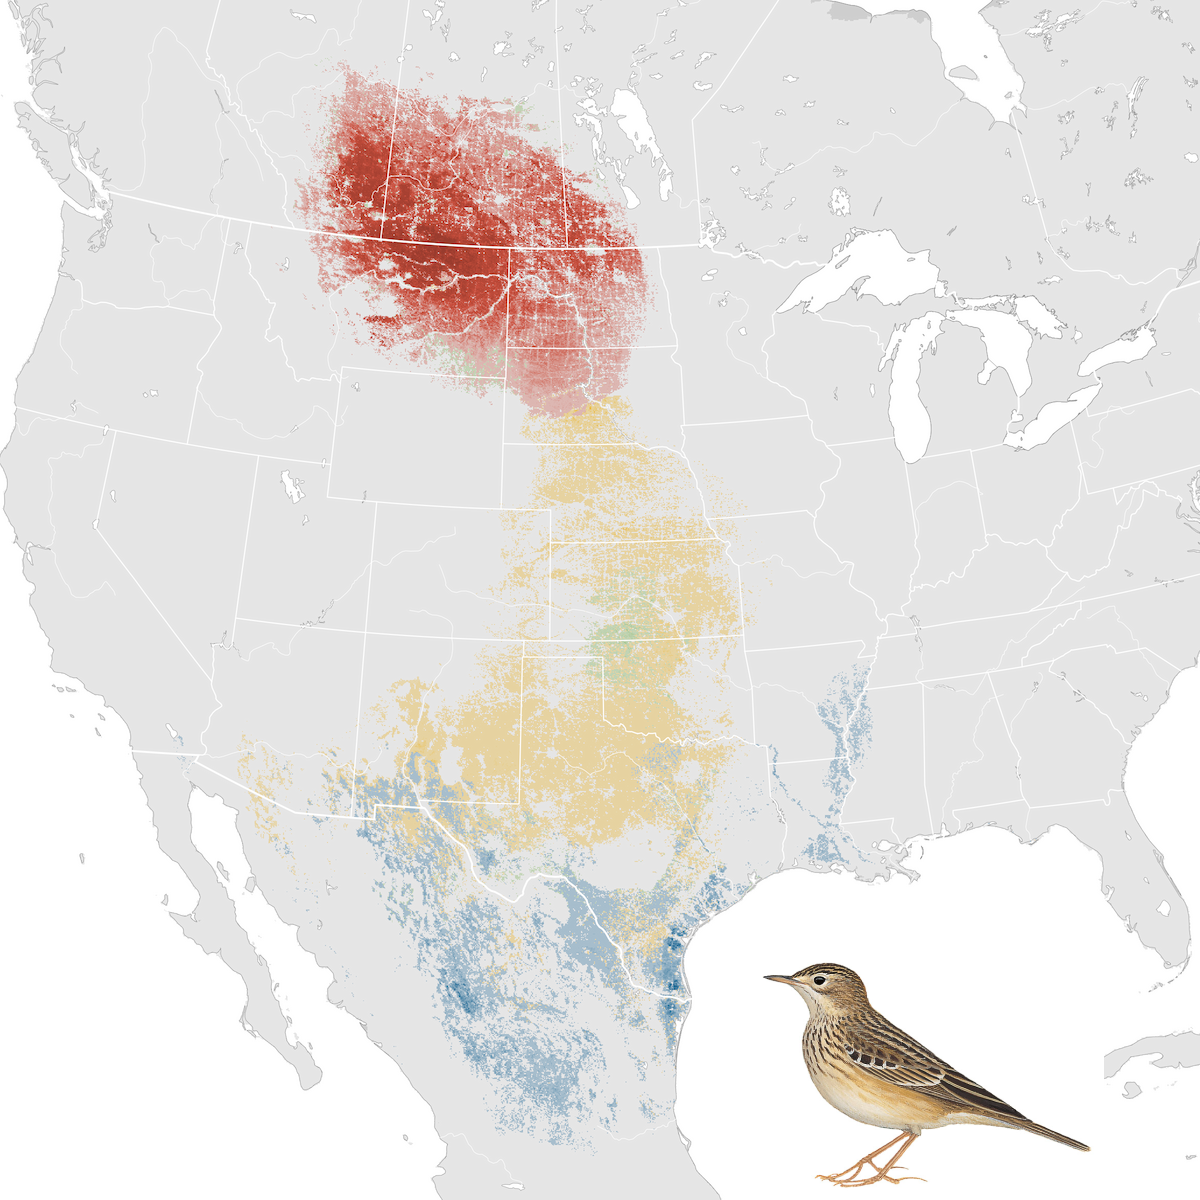
Relative abundance of Sprague’s Pipit is depicted for each season along a color gradient from a light color indicating lower relative abundance to a dark color indicating a higher relative abundance. Relative abundance is the estimated number of individuals detected by an eBirder during a traveling count at the optimal time of day. The breeding season is shaded in red; the non-breeding season is shaded in blue; and locations where the species is present during the pre-breeding migration are shaded green and post-breeding seasons are shaded in yellow. Sprague’s Pipit illustration © Ren Hathway/Lynx Edicions
Although previous research aimed at identifying causes of decline found equivocal results when it came to the impact of roads on Sprague’s Pipits, results from the eBird abundance models show that roads may be affecting pipits after all. In Montana, Alberta, and Saskatchewan tiny lines are breaking up otherwise contiguous detections of Sprague’s Pipits. Those tiny lines are roads, suggesting that Sprague’s Pipits may be avoiding areas near roads. Armed with this knowledge, researchers can investigate the impacts more thoroughly to better understand how road density impacts Sprague’s Pipits and other declining grassland birds.
Map key
Relative abundance is depicted for each season along a color gradient from a light color indicating lower relative abundance to a dark color indicating a higher relative abundance. Relative abundance is the estimated number of individuals detected by an eBirder during a traveling count at the optimal time of day for each species. Locations where the species is present year round are shaded in purple; the breeding season is shaded in red; the non-breeding season is shaded in blue; and locations where the species is present during the pre-breeding migration are shaded green and post-breeding seasons are shaded in yellow. Areas of light gray indicates species absence (or very rare occurrence). Areas of dark gray indicate areas in which predictions could not be made due to lack of data.